Administration console
The administration console is composed of several CRUDs used to maintain all the entities of the Catalog such as providers, components, sensors, users, … Only registered users can access it, so you must be logged before starting to manage the Catalog (the login access is located at the top right menu bar). Remember that, by default, the admin user has admin/1234 as access credentials.
All admin pages follow the same structure and layout for ease of use and to facilitate future maintenance. Therefore, below there is only a brief description of each admin page rather than to repeat the same things over and over in every section. In these sections will focus only on the particularities of each one.
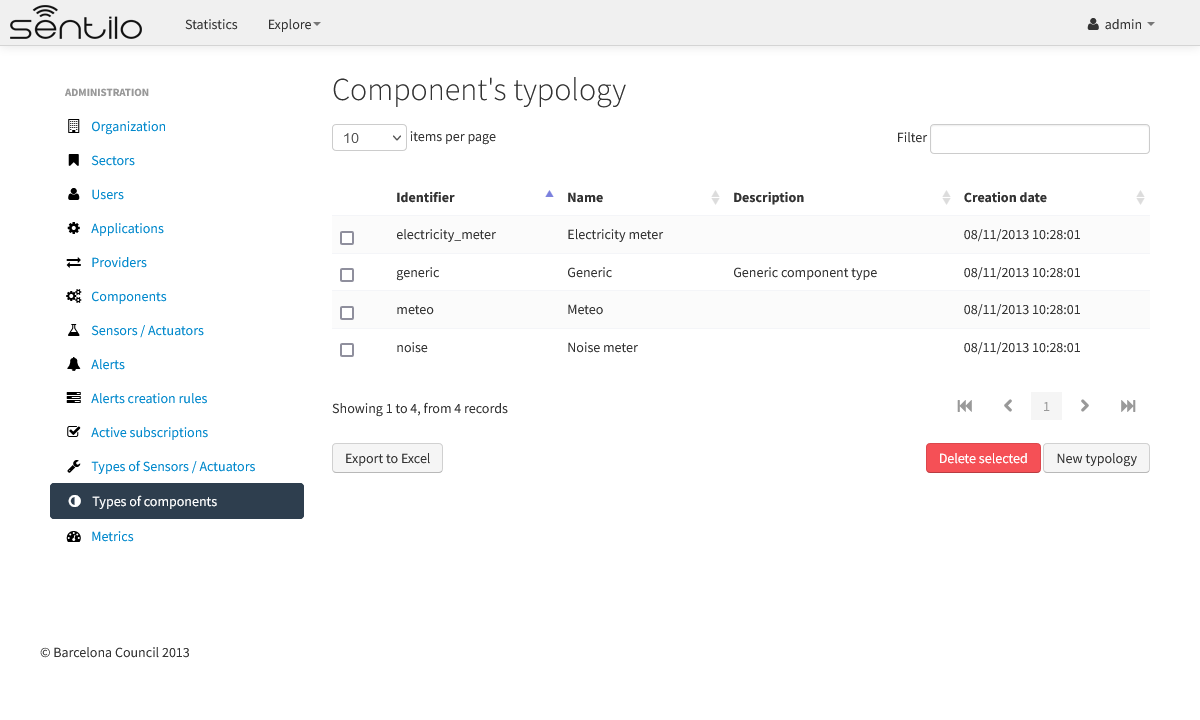
When you select any option of the menu admin, the first page that you will see will be a list with the resources of this type already registered on the Catalog. These lists are very intuitive and extremely easy-to-use: you could filter, page and order it. You could delete an existing resource selecting the corresponding checkbox and clicking the Delete selected button; you could add new resources selecting the corresponding button and you could edit anyone clicking over the corresponding row.
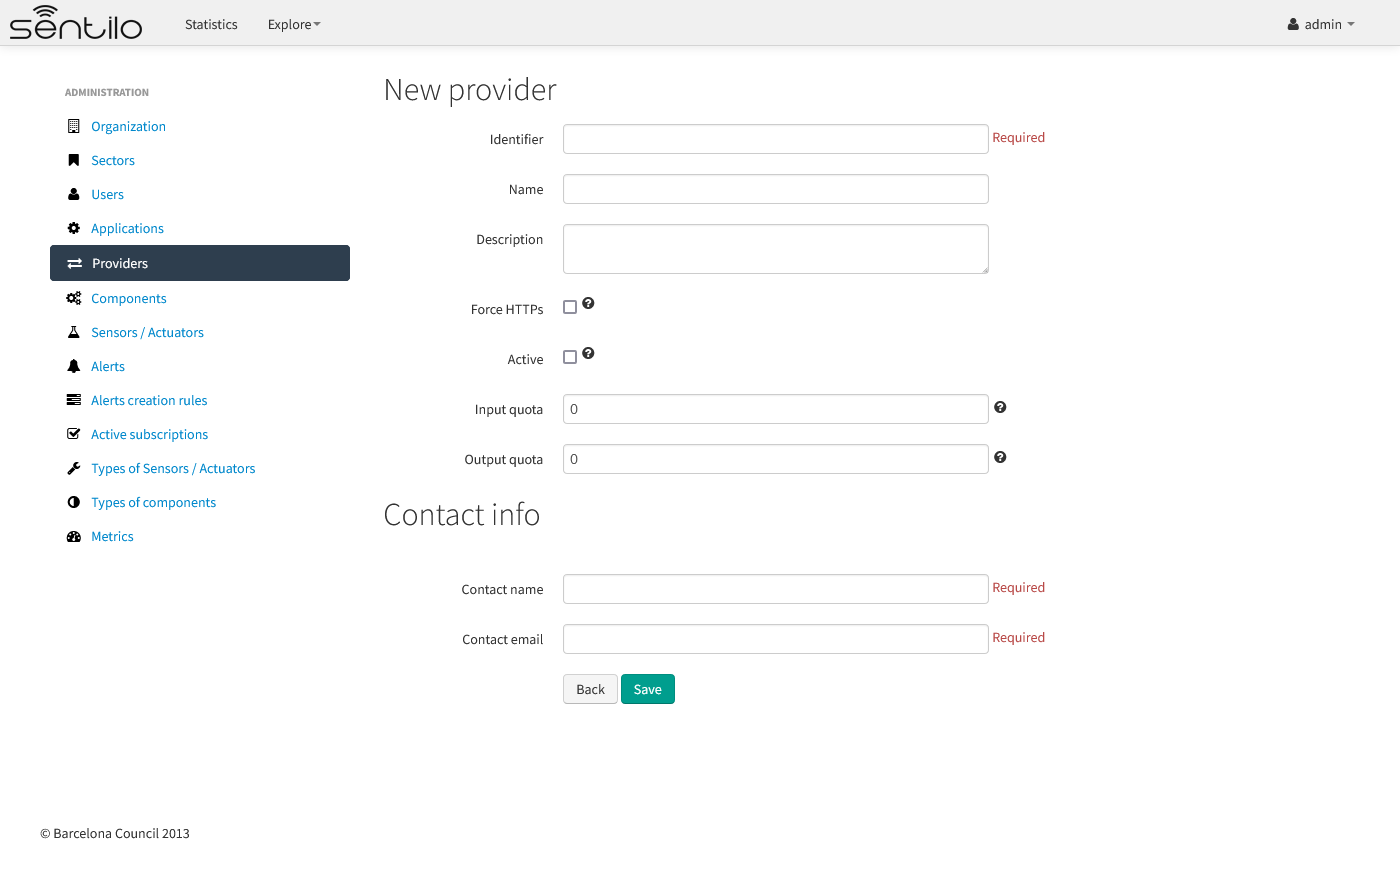
When you select to add a new resource, a traditional form page is displayed. Here, you must have filled in the mandatory fields before clicking the Save button. If some mandatory field is not filed in or it have a no valid value, the page shows you information about what is wrong:
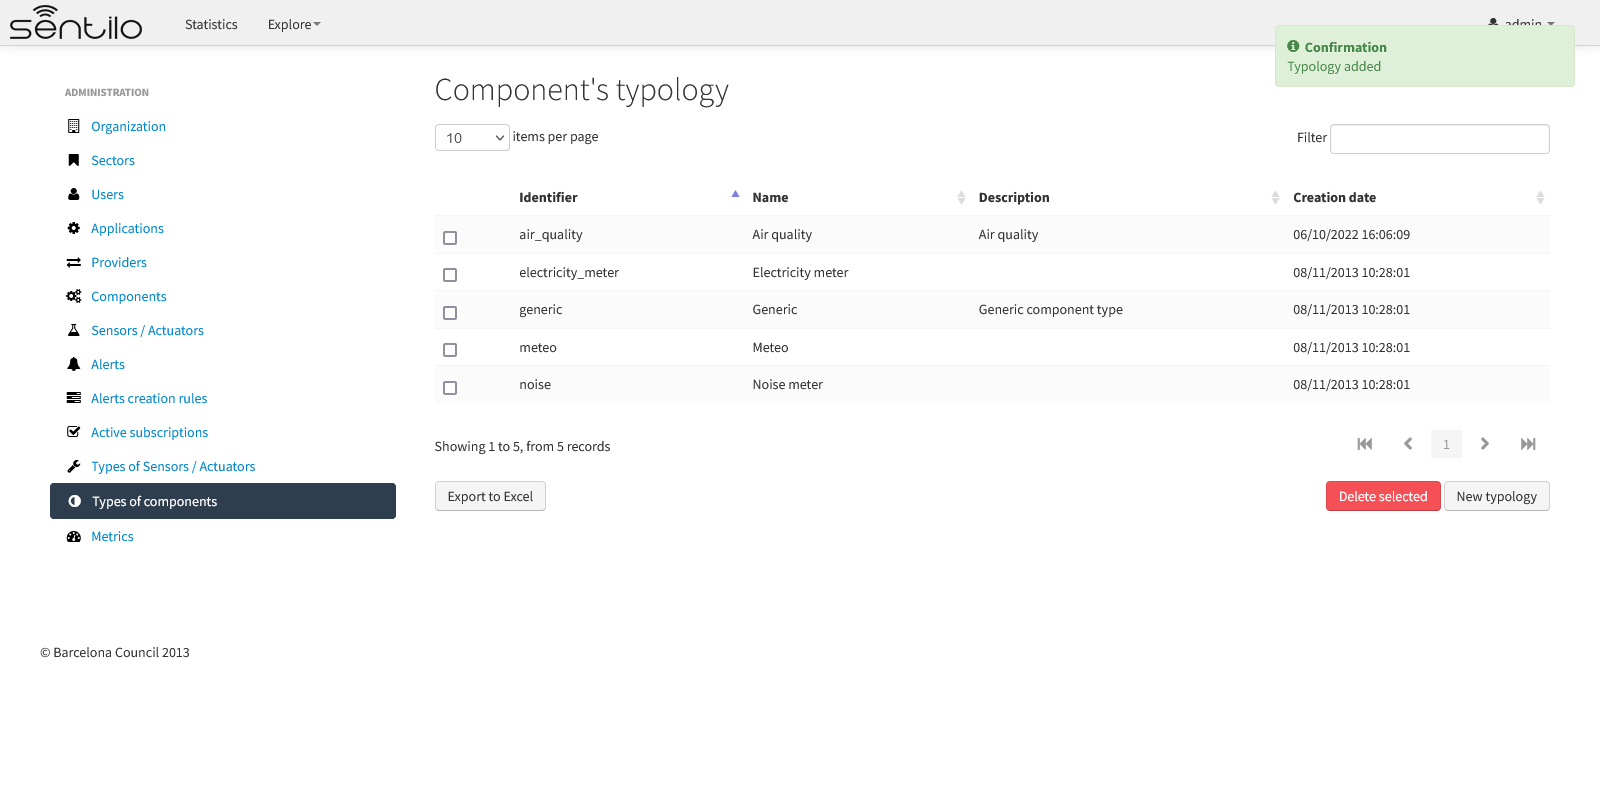
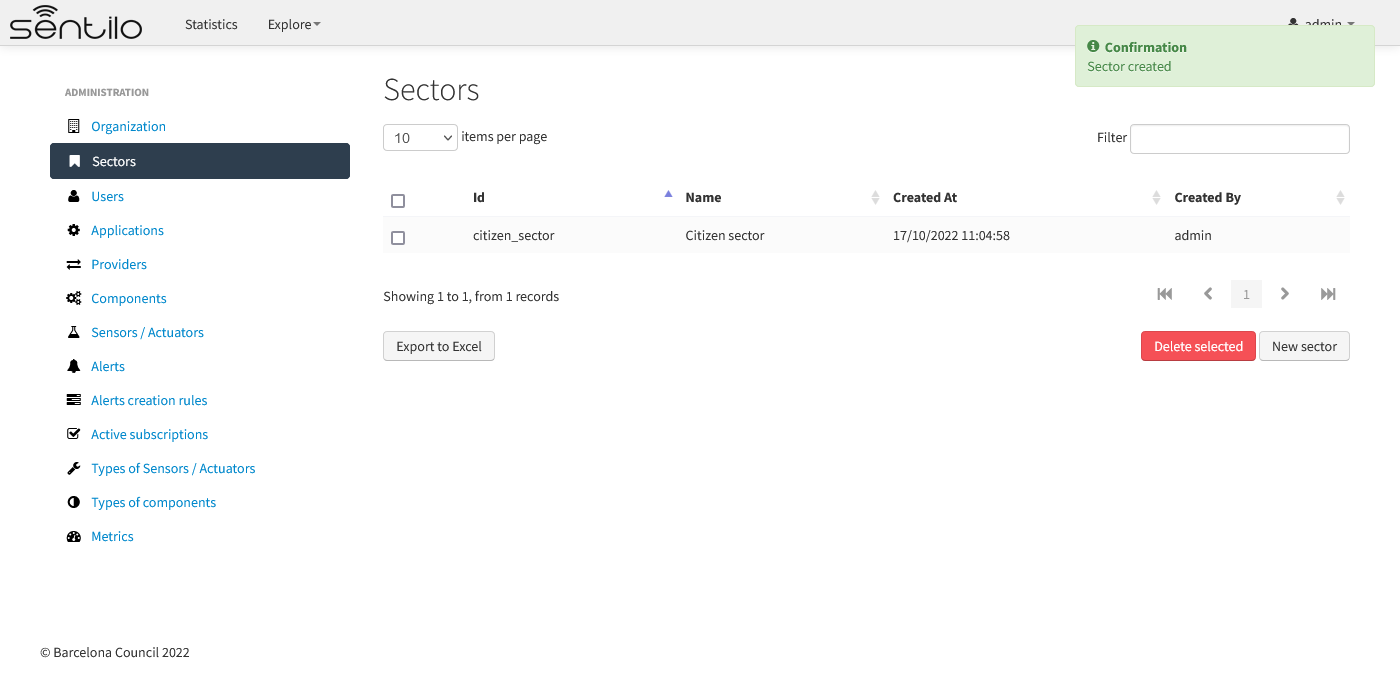
Otherwise, the resource will be registered into the Catalog and you will be redirect to the list page (at the top right corner you will see a confirmation message that the resource have been successfully created):
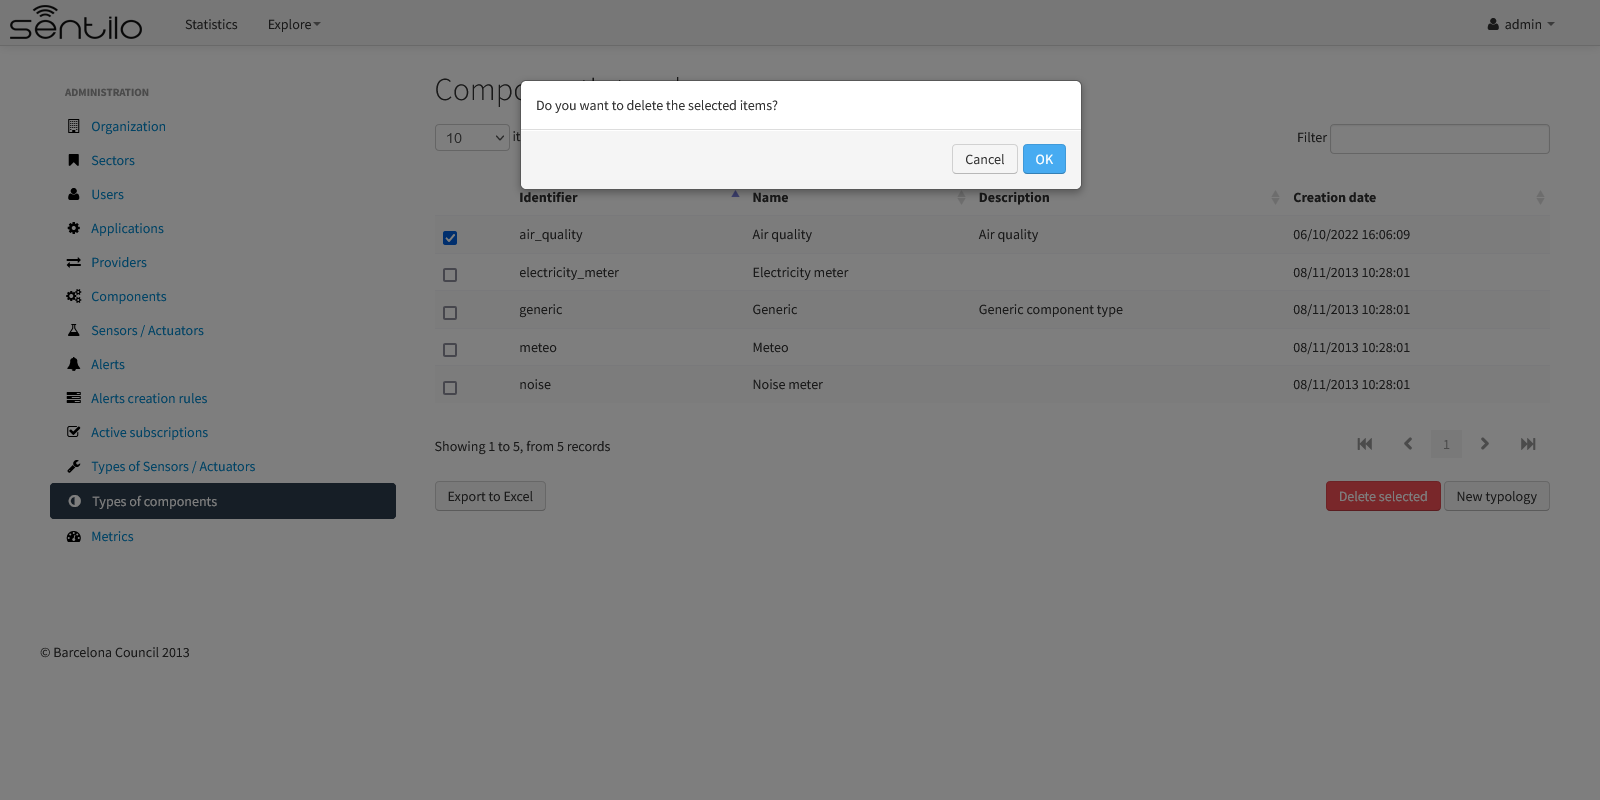
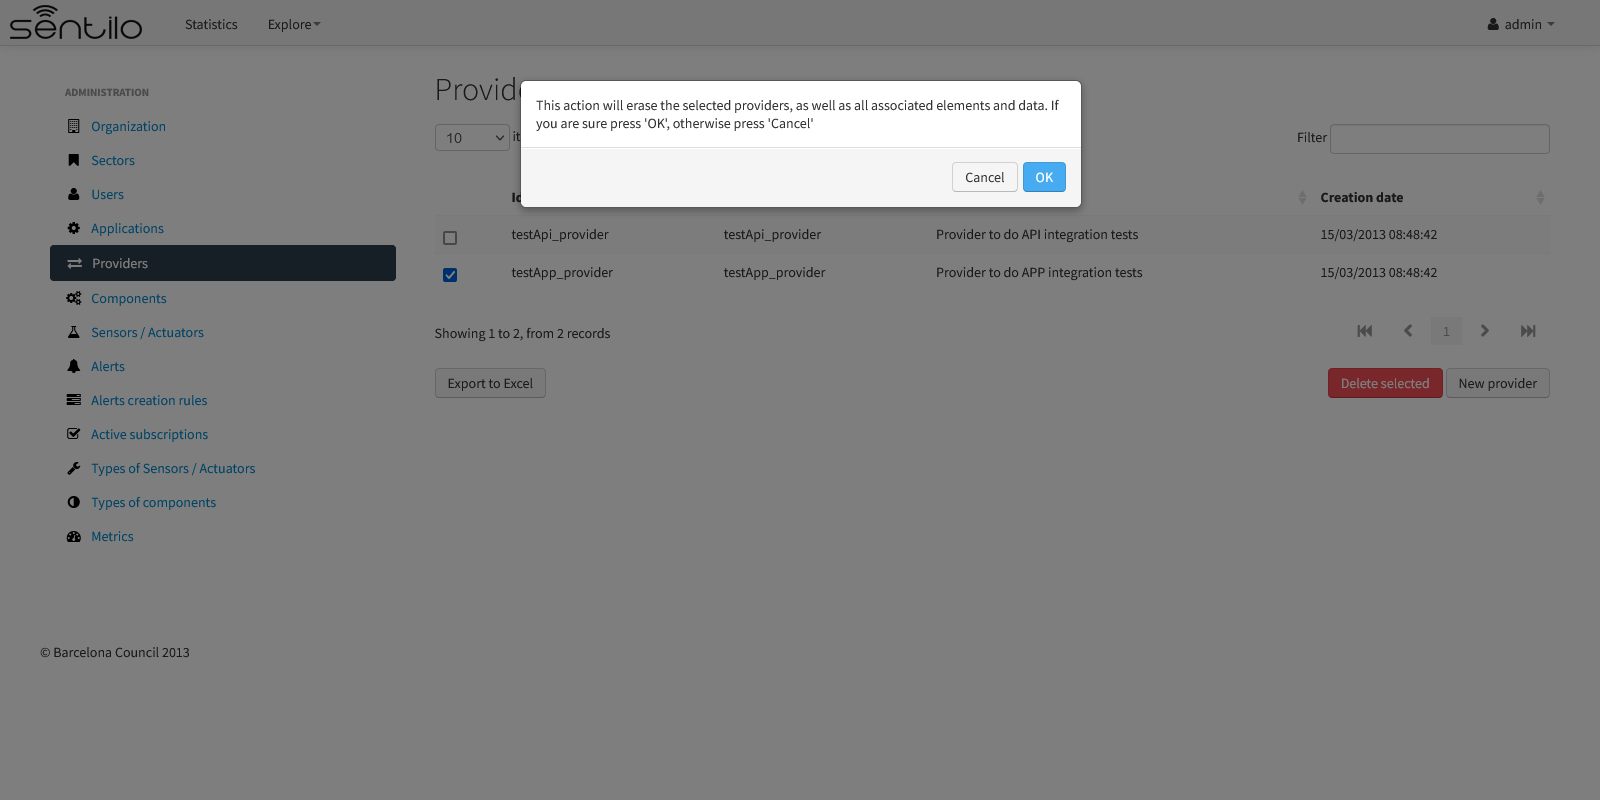
The same applies when you try to delete a resource, but with the peculiarity that the browser will always ask for your confirmation before deleting it:
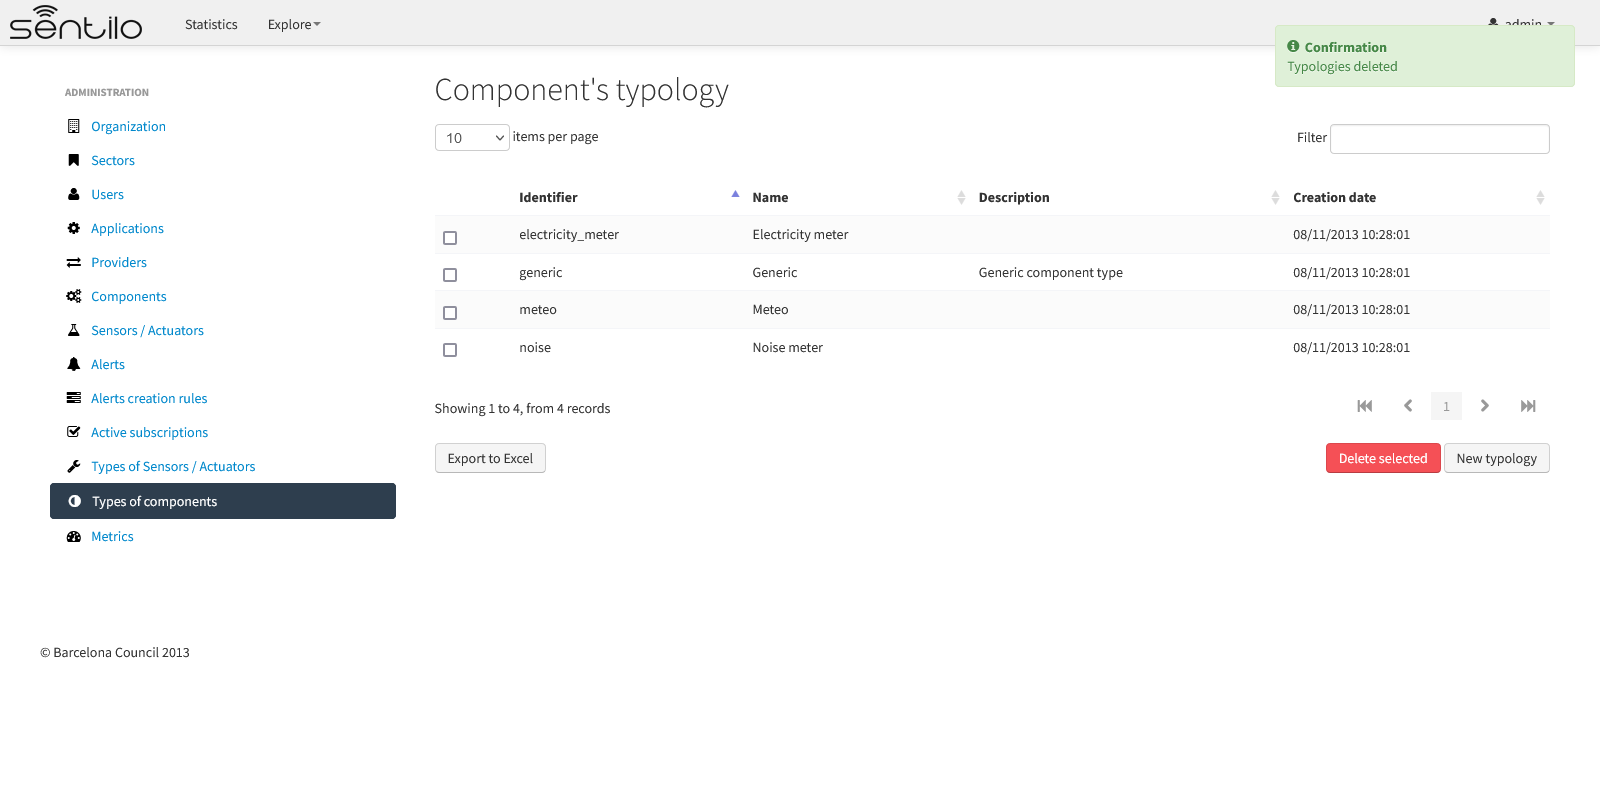
If the resource has been successfully removed, the list is reloaded and a confirmation message is displayed at the top right corner:
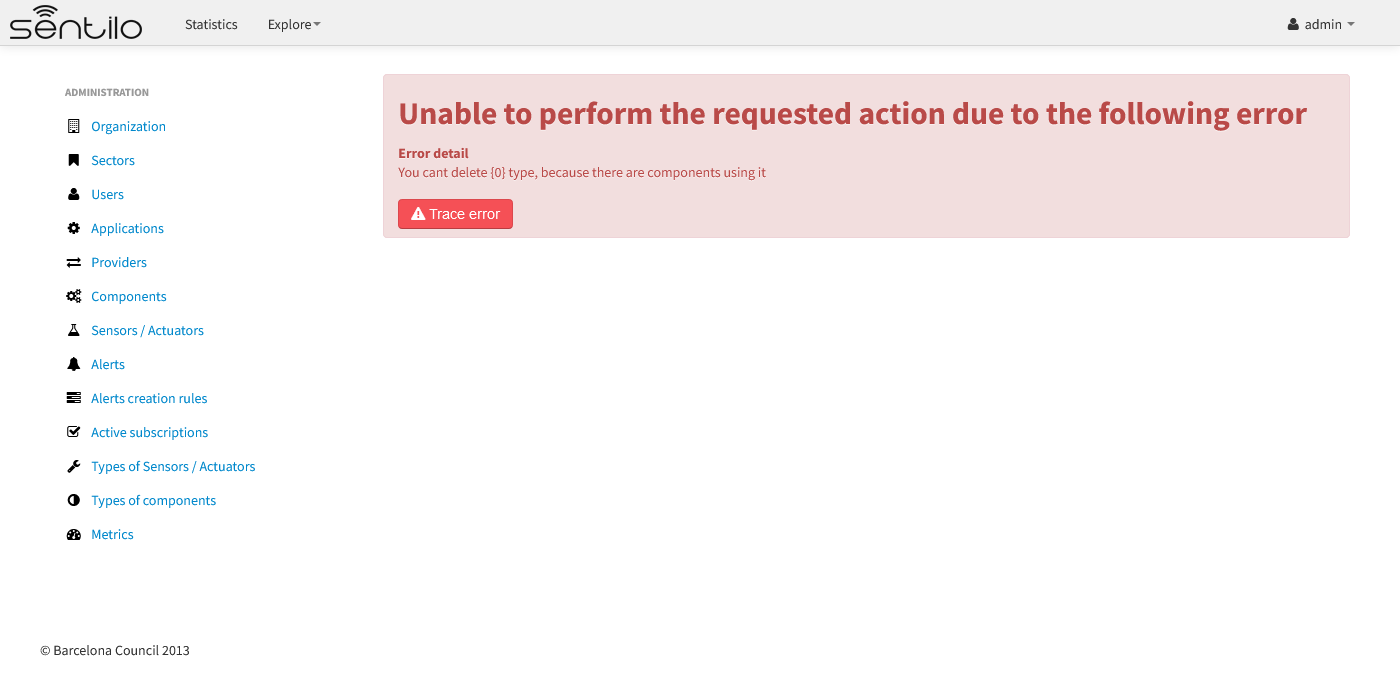
Otherwise, you will see an error page with a description about what is wrong. For example, if you try to delete a component type that is associated with an existing component the response will be :
Organization
The organization is the entity that describes the Sentilo instance.
Detail
By default, this organization is created and its identifier is sentilo.
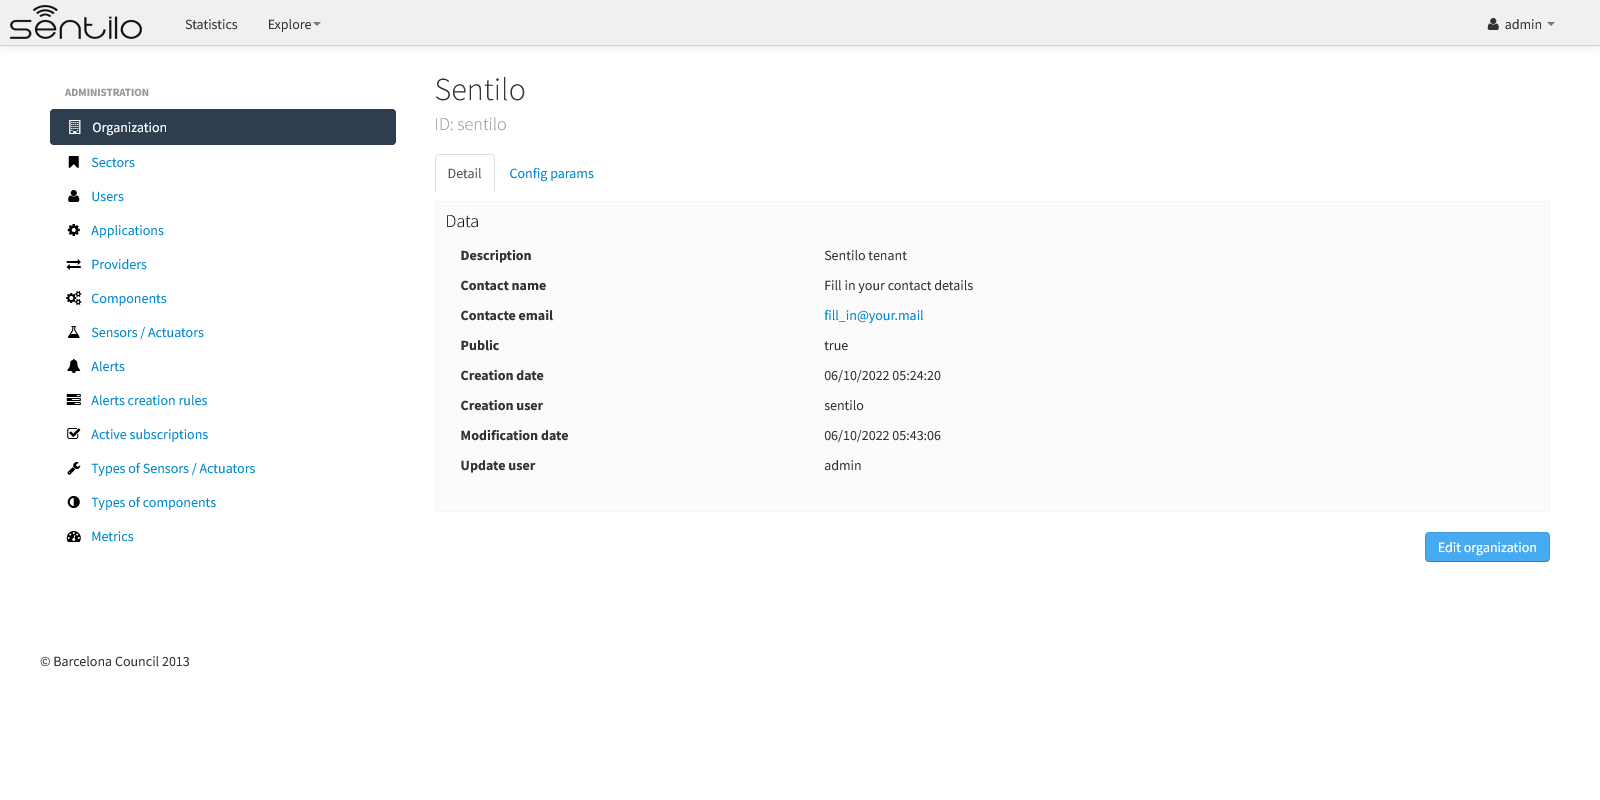
We can also edit the organization’s name other contact details, except the.
Config params
In addition, we can edit the visualization formats and public map settings, using the Config params tab:
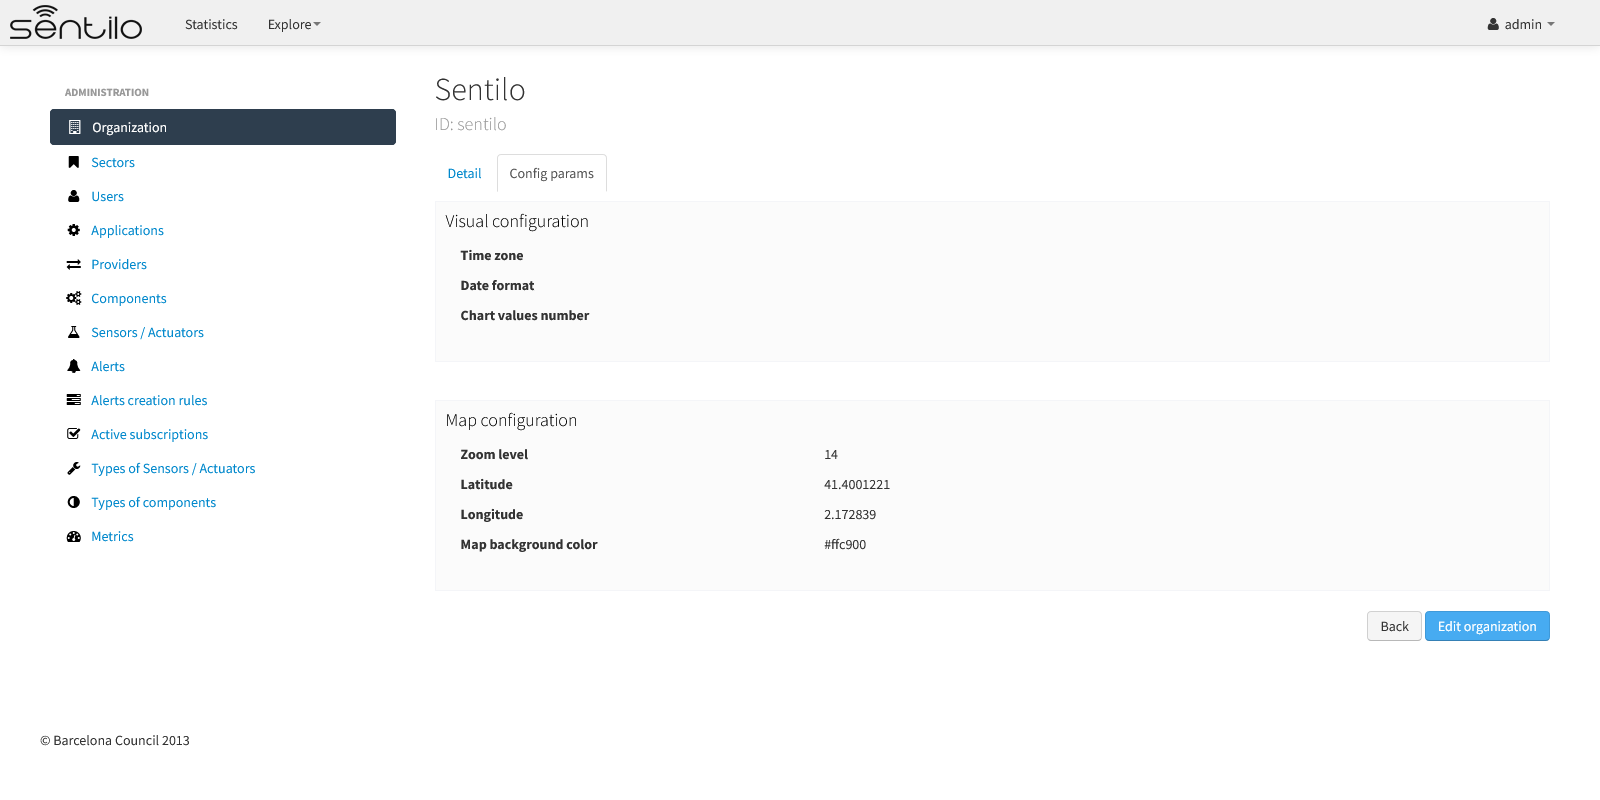
There we can configure the Visual configuration and the Map configuration.
Visual configuration
These params will apply to the entire catalog application visual customization, and how the user will see the data. Note that time zone & date format are directly relationated.
| Property | Description | Comments |
|---|---|---|
| Time zone | Defines the time zone of the organization, and modifies the way to display data on screen, such as dates | You can define hourly difference or time zone abbreviations: CET, UTC, +001… |
| Date format | Defines the date format with which the data will be displayed in the application (lists, details…) | Example: dd/MM/yyyy HH:mm:ss = 30/11/2017 15:34:56 See all possible formats as Java Date Format, at: Java Date Format |
| Chart values number | Number of observations displayed on chart | It must be a positive integer number greater or equals to 10. If blank, it will be a default value of 10. This value will be overwritten by sensor’s configuration one. |
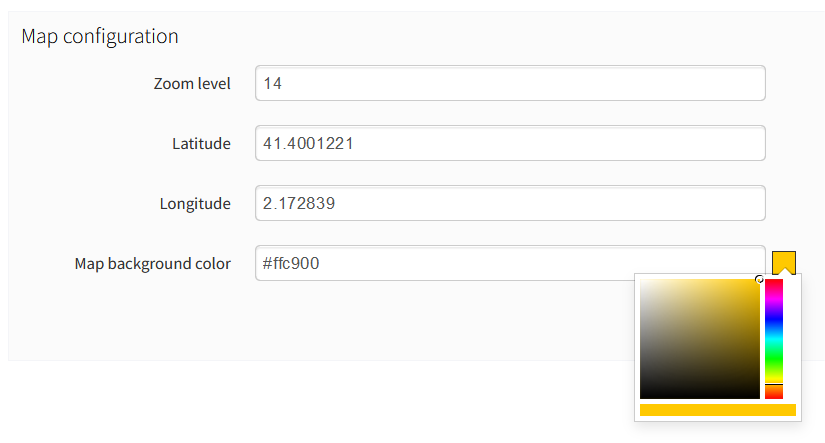
Map configuration
These params configure the universal map visualization.
| Property | Description | Comments |
|---|---|---|
| Zoom level | Zoom level of the universal map | Default value is 14. And you can define a value between 1 and 20. See possible values in: https://developers.go ogle.com/maps/documen tation/static-maps/in tro#Zoomlevels |
| Latitude / Longitude | Defines the map center in latitude & longitude values format | |
| Map background color | Define the background color of the map | Possible values applies with the colorpicker, or input a valid css / html color value |
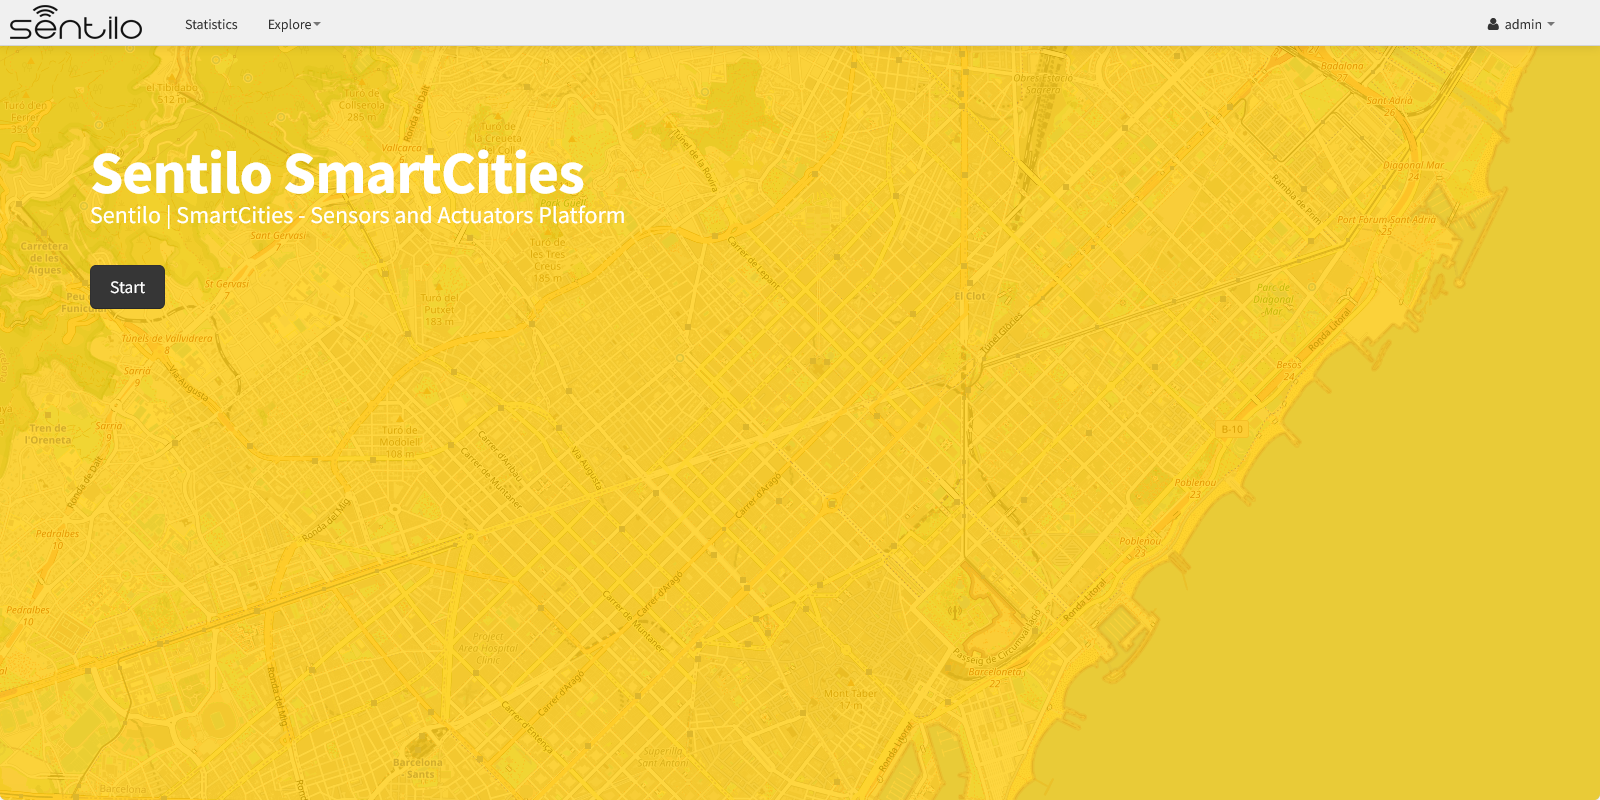
For example, set the map background color to #ffc900:
will result in:
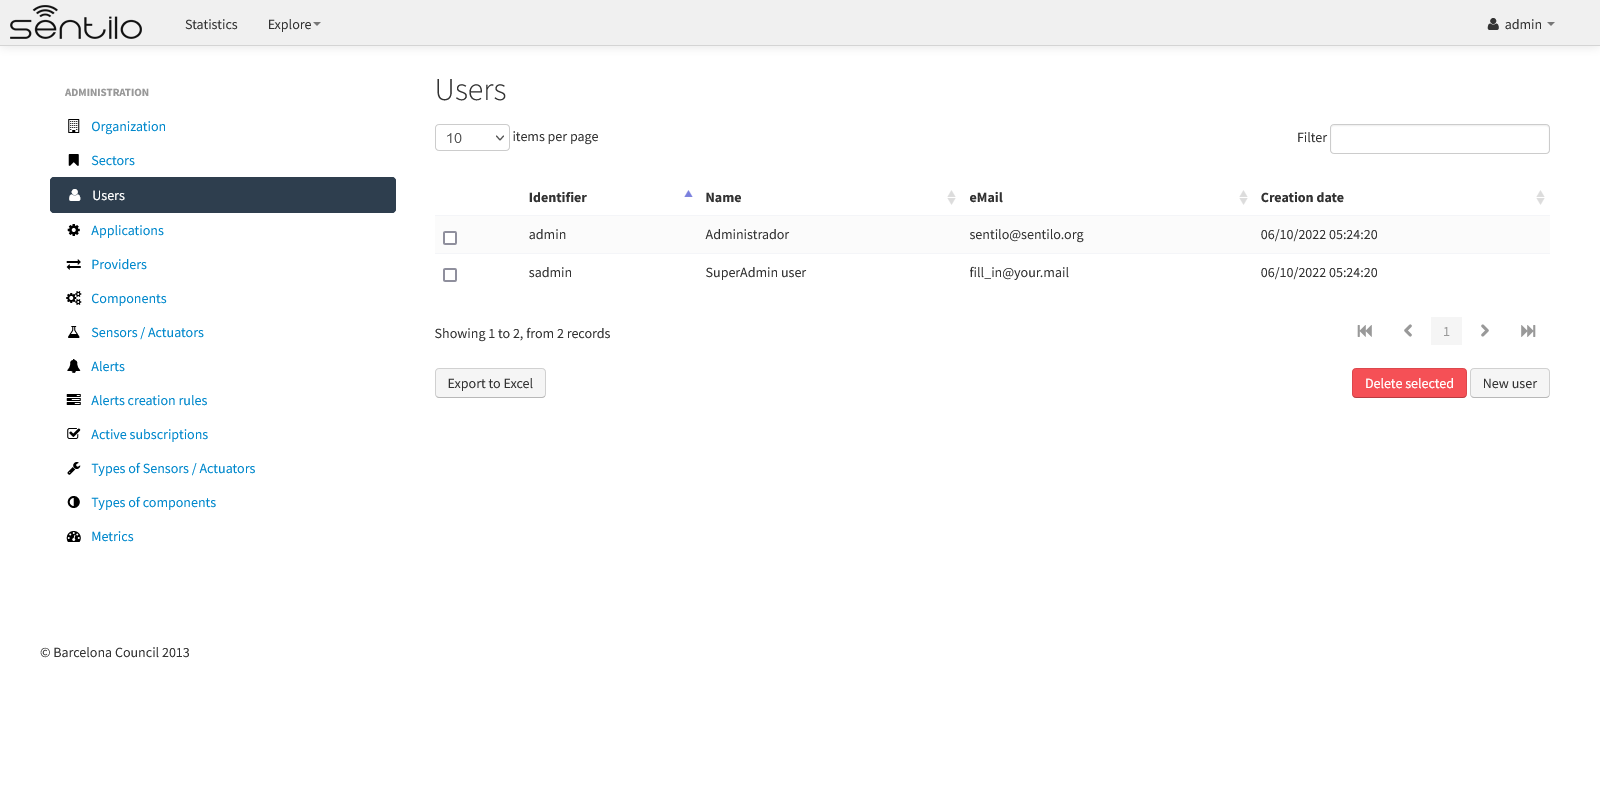
Users
The “Users” section is for managing users of the catalog application. It’s possible to A catalog user can be one of these three roles:
- Super Admin: role for super-administration purposes (for multitenant version only).
- Admin: role for administration purposes.
- User: visualisation role, they could access to the administration console and read all the data, but they haven’t permission for changing anything, except own contact details and password.
- Platform: platform role for internal use (hidden, non selectable).
Note
A non-admin account will only see a menu “User” with his/her own details. A User role cannot see list other users.
User properties editable by administrator
| Id | Name | Description |
|---|---|---|
| Id | User identifier | After its creation can’t be modified |
| Password | Password | Admin user can rewrite user’s password |
| Repeat | Password check | |
| Name | User name | |
| Description | Description | |
| Creation date | Creation date | Automatically generated |
| Update date | Last update date | Automatically generated |
| User e-mail | ||
| Active | Checkbox for removing access | |
| Role | Related role | Value list |
Edit a User
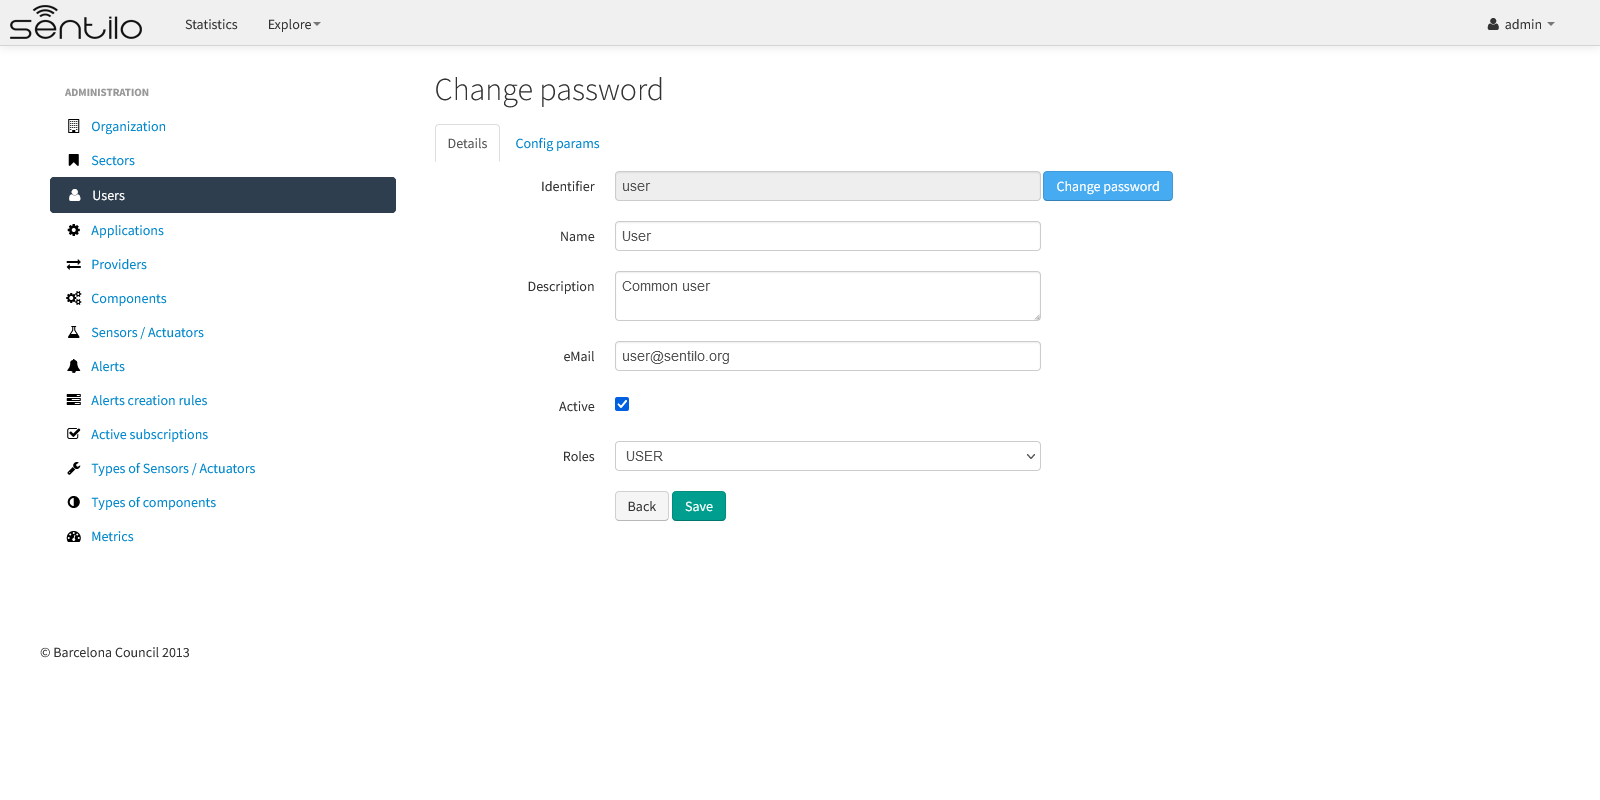
Note
A password has to have 8-10 characters, and have at least 1 uppercase, 1 lowercase and 1 digit.
Applications
Applications are the data clients of the Sentilo platform and, by default, if you have loaded the default data, you will see two applications registered into the Catalog:
- sentilo-catalog: it is a internal application, used by the catalog to make calls to the API REST and therefore MUST NOT be removed.
- testApp: as the name suggest, this application is used for testing the platform status.
List
Access the Application list. This is the main Application page. From here you’ll can access to the desired application to show its details by click on it.
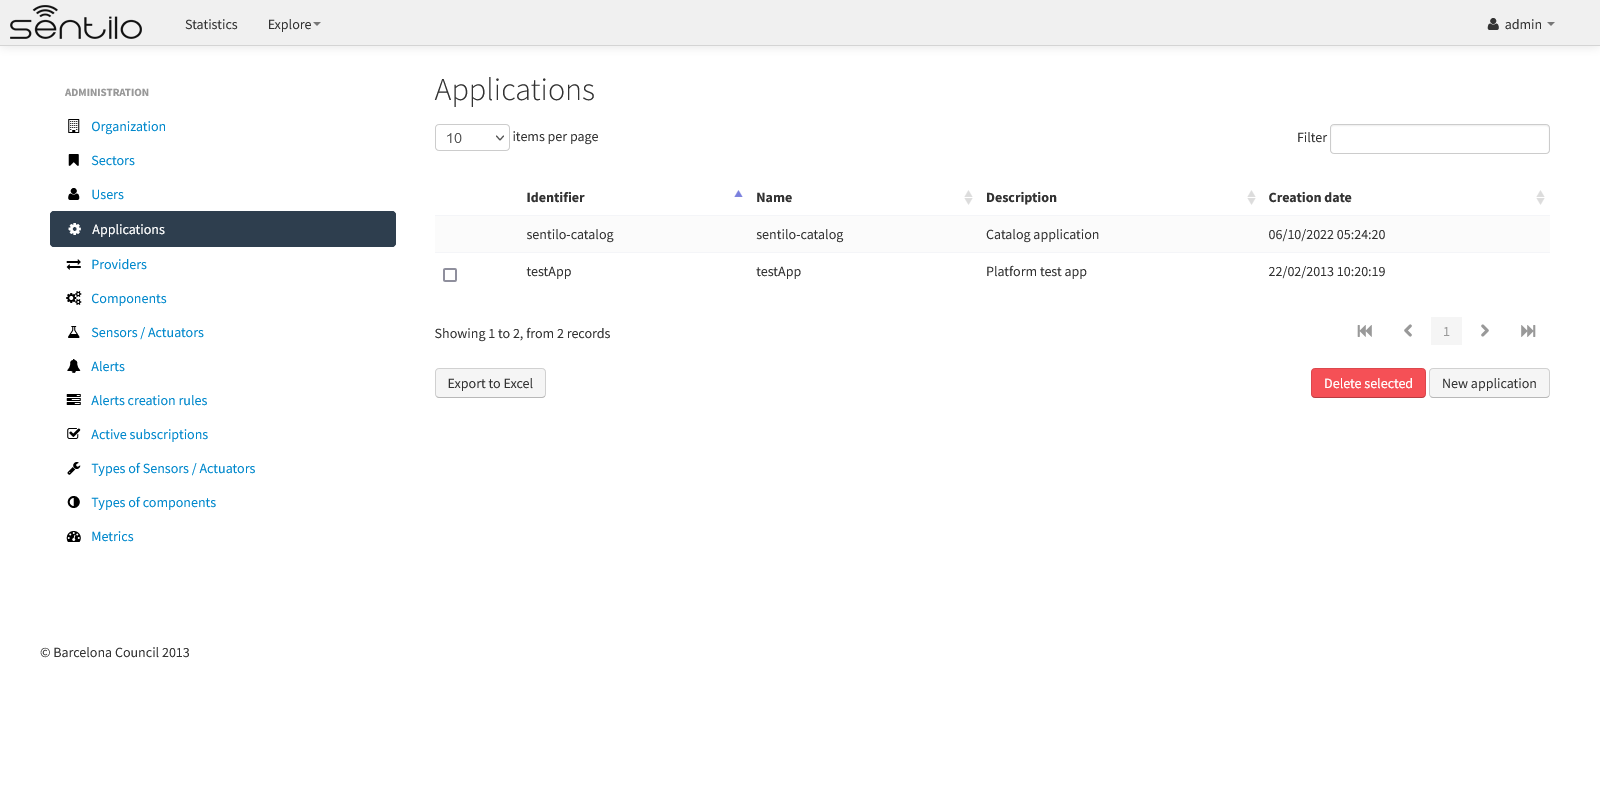
You’ll be able to list, filter, show application details, create (New application button) and delete selected applications (select from left checkbox, and apply by Delete selected button).
Further, you’ll be able to export the list to Excel, by clicking on Export to Excel button. The result file will contain the list columns and a number of extra ones from internal database use.
Use the button panel at the bottom right to navigate through the list (first page, previous page, page number, next page and last page, respectively).
Details tab
The detail page is structured into three tabs:
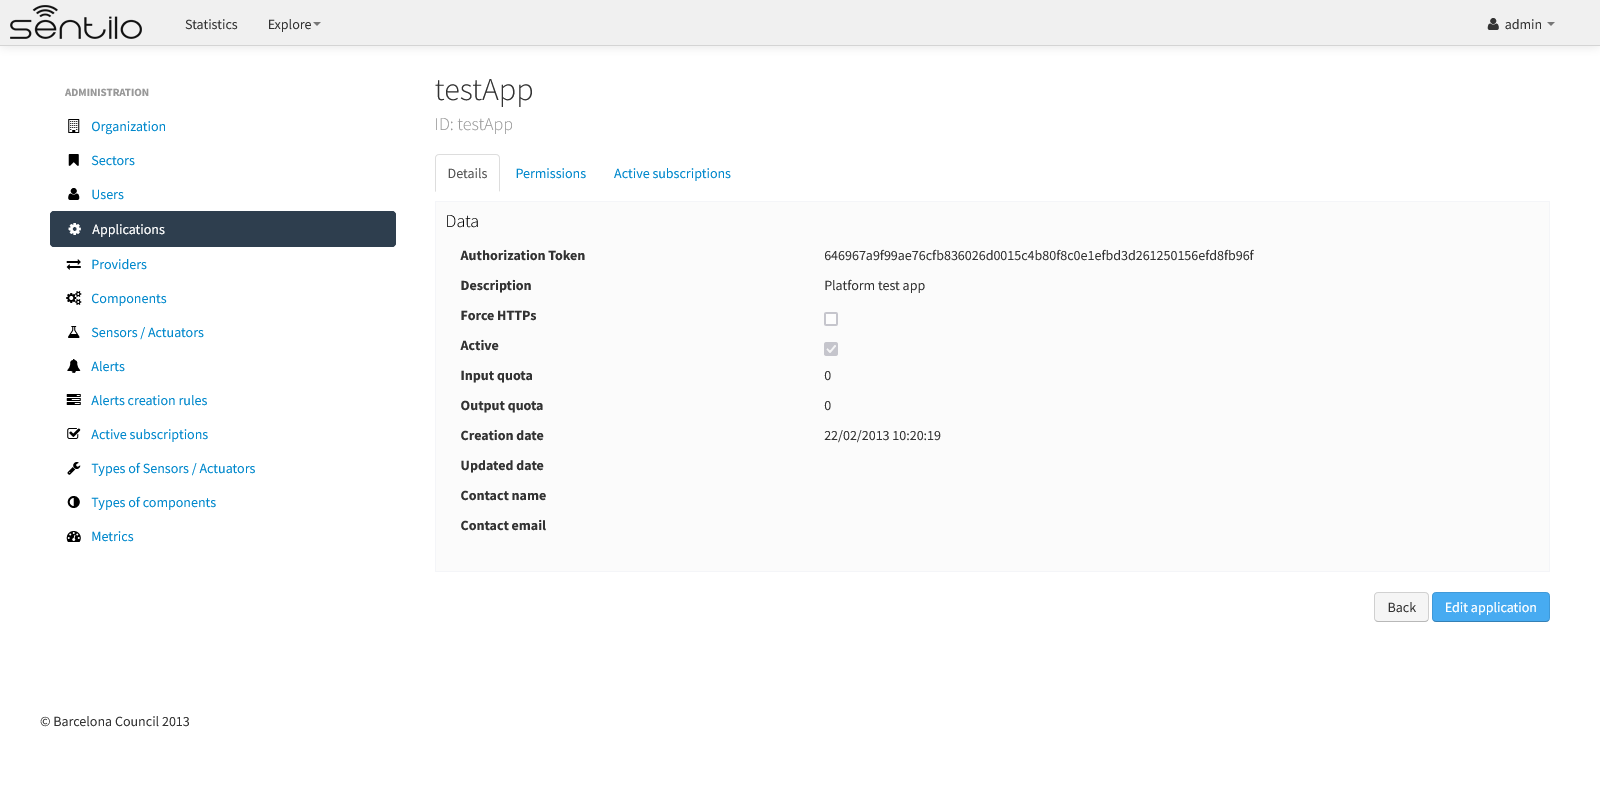
where:
- the Details tab contains the main properties of the application (described below).
- the Permissionstab allows to manage the permissions for other entities (applications or providers)
- the Active subscriptions tab displays a list with all the active subscriptions for the current application.
The main properties of the Details tab are the following:
| Property | Description | Comments |
|---|---|---|
| Id | Application Identifier | Mandatory. After its creation it can’t be modified. It is the identifier used in the API calls. |
| Name | Display name | If not filled in by the user, its default value will be the Id. |
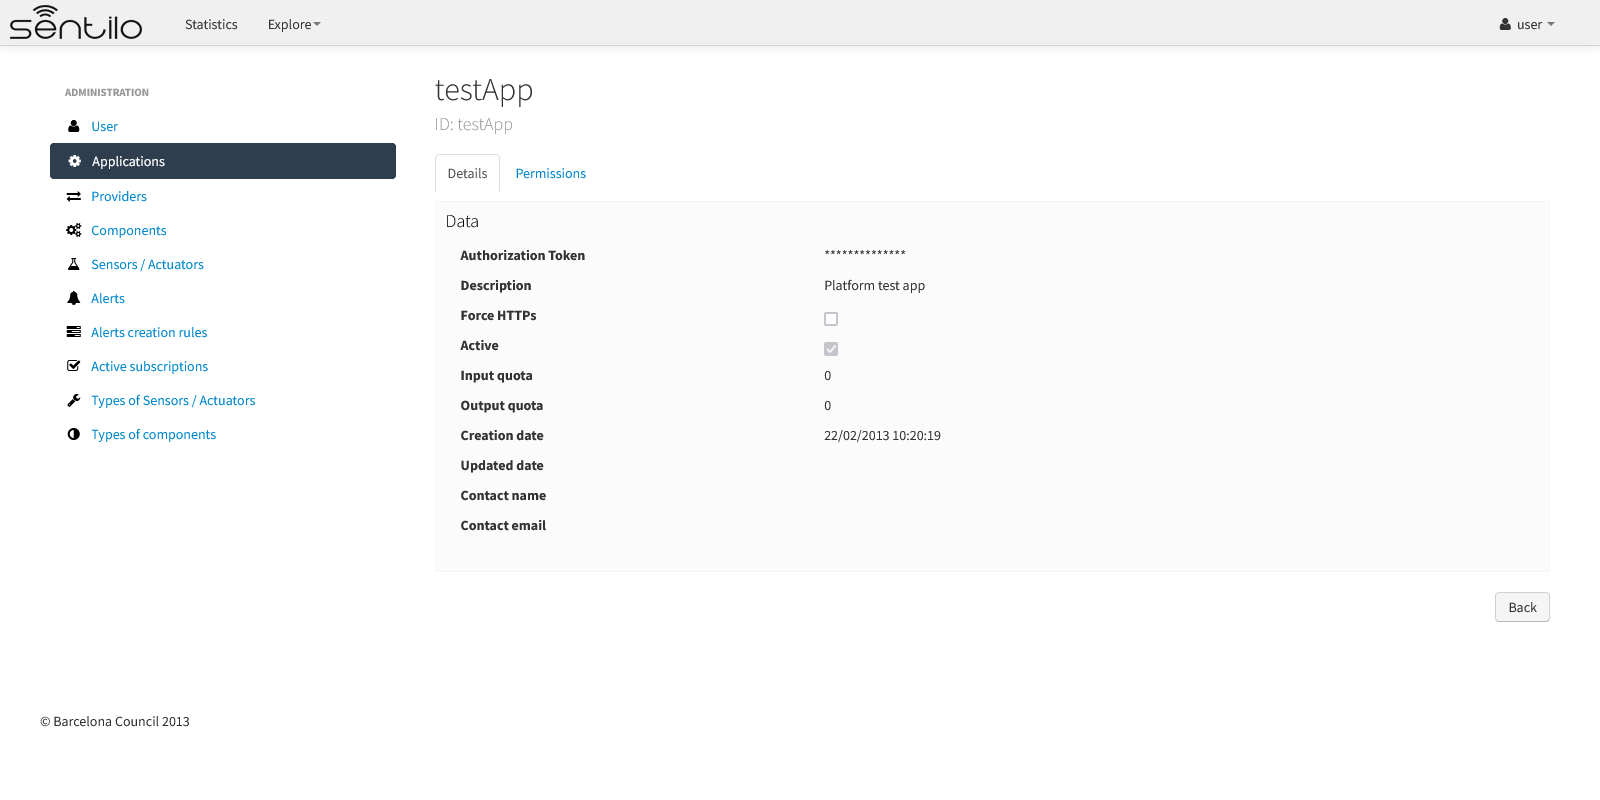
| Token | Access key | Automatically generated by the system when application is created. It is theidentity_key value used in the API calls. NOTE: only users with ADMIN role will show the entire token chain, other user roles only will see obfuscated text at this place (see below) |
| Description | Description | Optional. The application description text. |
| Force HTTPs | Application accepts data over HTTPS | The Sentilo Server itself does not support SSL at the moment, however you can put a reverse proxy such as Nginx in front of the Sentilo Server. If this option is checked, the Sentilo Server expects the standard header X-Forwarded-Proto
Please note that when configuring Nginx, you should also use the parameter underscores_in_hea
ders on;
so Nginx would forward sentilo headers to the Sentilo Server. |
| Active | Indicates if the resource is active or not (if it is not, it will not accept any type of interaction nor will it be shown in other sections) person responsible for the application | |
| Input quota | Max number of inputs per hour (set to 0 to don’t limit it) | Optional, 0 indicate unlimited quota (see Rate Limiting) |
| Output quota | Max number of outputs per hour (set to 0 to don’t limit it) | Optional, 0 indicate unlimited quota (see Rate Limiting) |
| Creation date | Creation date | Automatically generated |
| Updates date | Last update date | Automatically generated |
| Contact name | The name of the person responsible for the application | Mandatory. |
| Contact email | Email address of the person responsible for the application | Mandatory. |
How users that has not ADMIN role see the detail section:
Permissions tab
As commented before, the Permissions tab allows you to define and manage the authorization privileges that are granted to an application (such privileges are named permissions) which are required for access to the data from other entities.
There are 3 possibles permissions:
- Read: Only allows to read the data but not modify it (e.g. cannot publish orders to sensors/actuators).
- Read-Write: allows to read and write data over the resources of an entity, but not administer them (e.g.. cannot create new sensors for a provider)
- Administration: full control over an entity and its resources.
By default, the application sentilo-catalog has granted the Administration permission over all entities registered into Catalog and, as you would expect, an application has full control over itself .
For example, at the following case where the permissions of the application testApp are displayed:
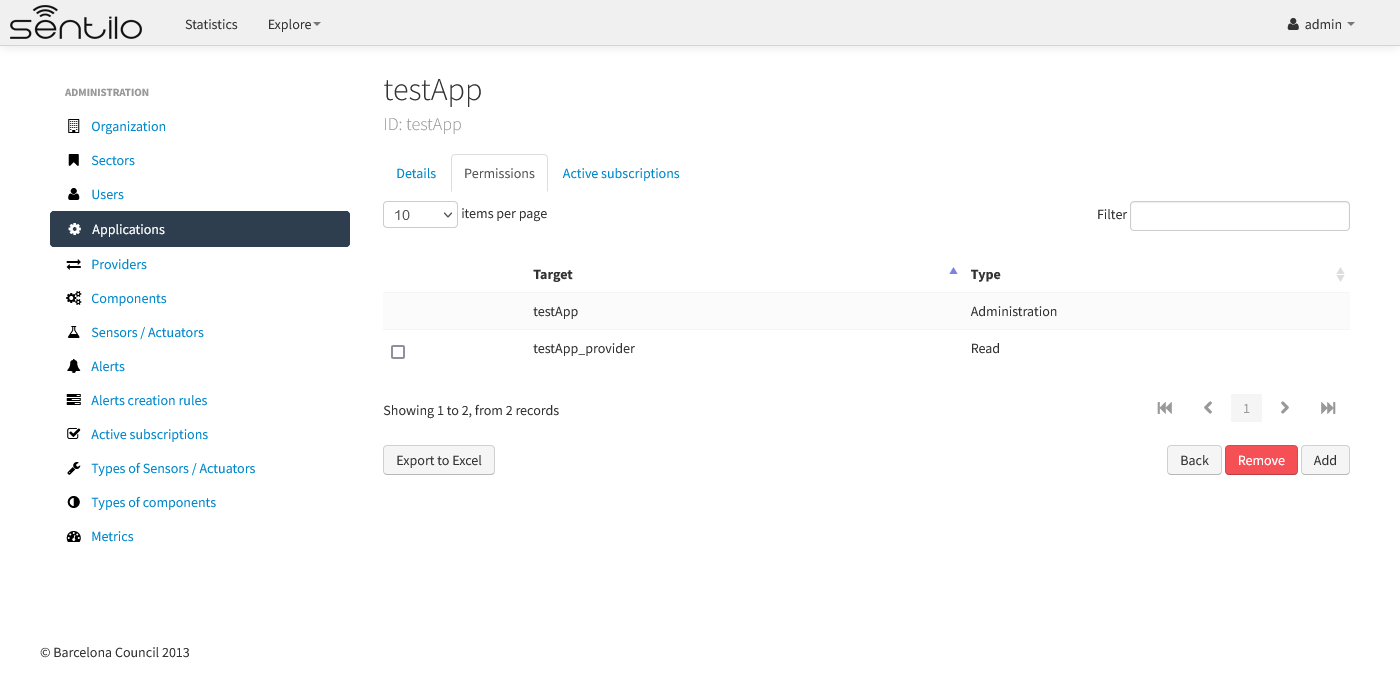
We will see the following:
- The application testApp could administer the entity testApp (obviously!)
- The application testApp could read any data from the entity testApp_provider.
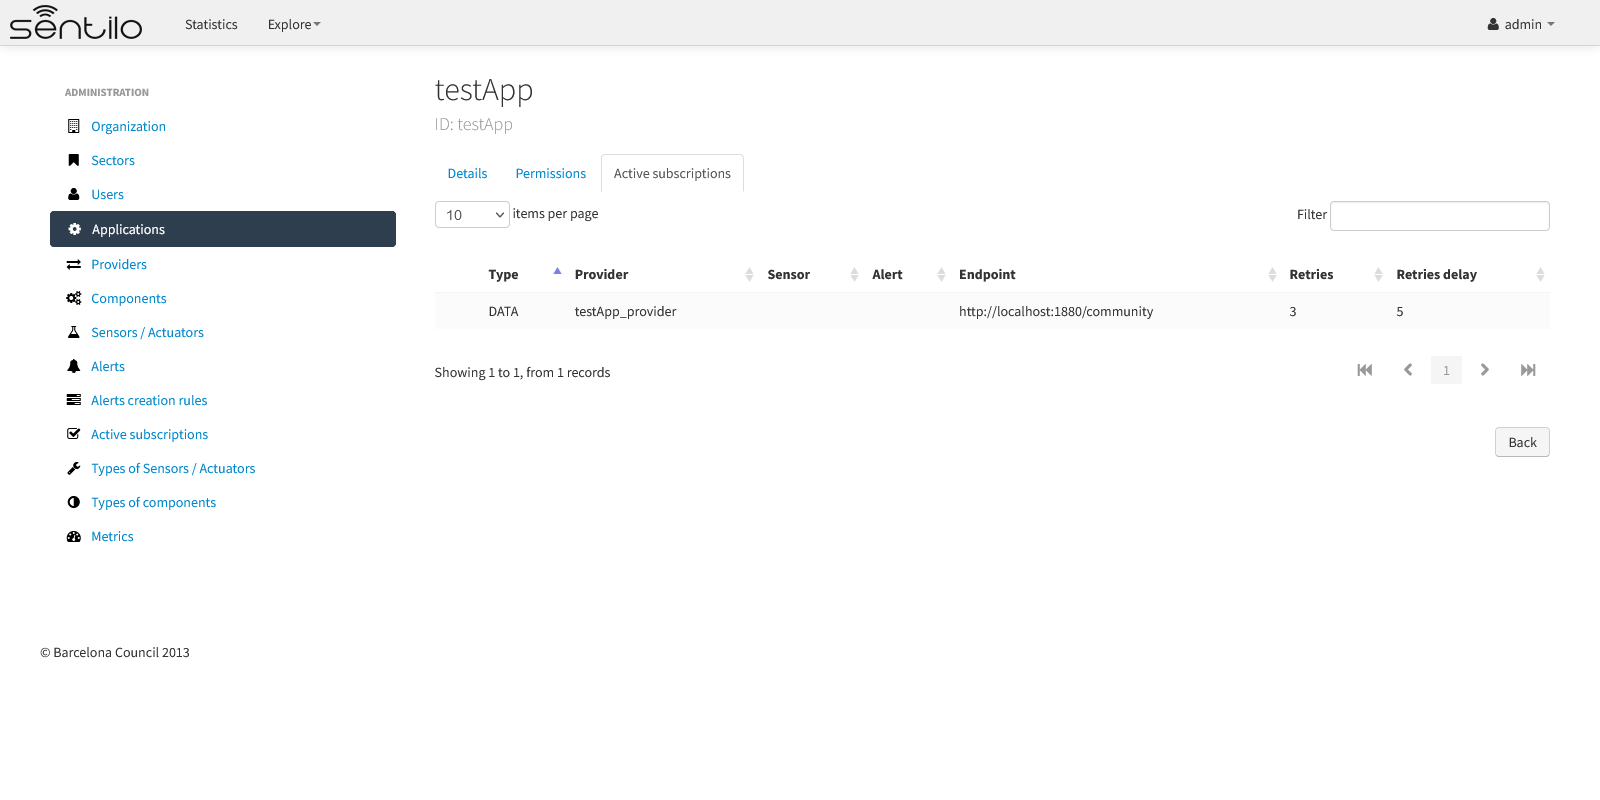
Active subscriptions tab
This tab allows you to inspect the subscriptions that an application has registered on the platform (remember that subscriptions are [created with the API REST](./api_docs/services/subscription/subscription.html)), as shown in the following picture:
Providers
In Sentilo, providers are those who send data, i.e. those who publish the data (in contrast to applications, which consume the data). If you have loaded the default data, you will see one default provider registered into the Catalog:
- testApi_provider: as the name suggests, this provider is used for checking platform api status.
- testApp_provider: as the name suggests, this provider is used for checking catalog application status.
One singularity of the providers list is the Delete action: if you remove a provider, not only the provider will be deleted from the backend, but also all its related resources such as components, sensors, alerts … and any data published by its sensors, so be very careful with this command.
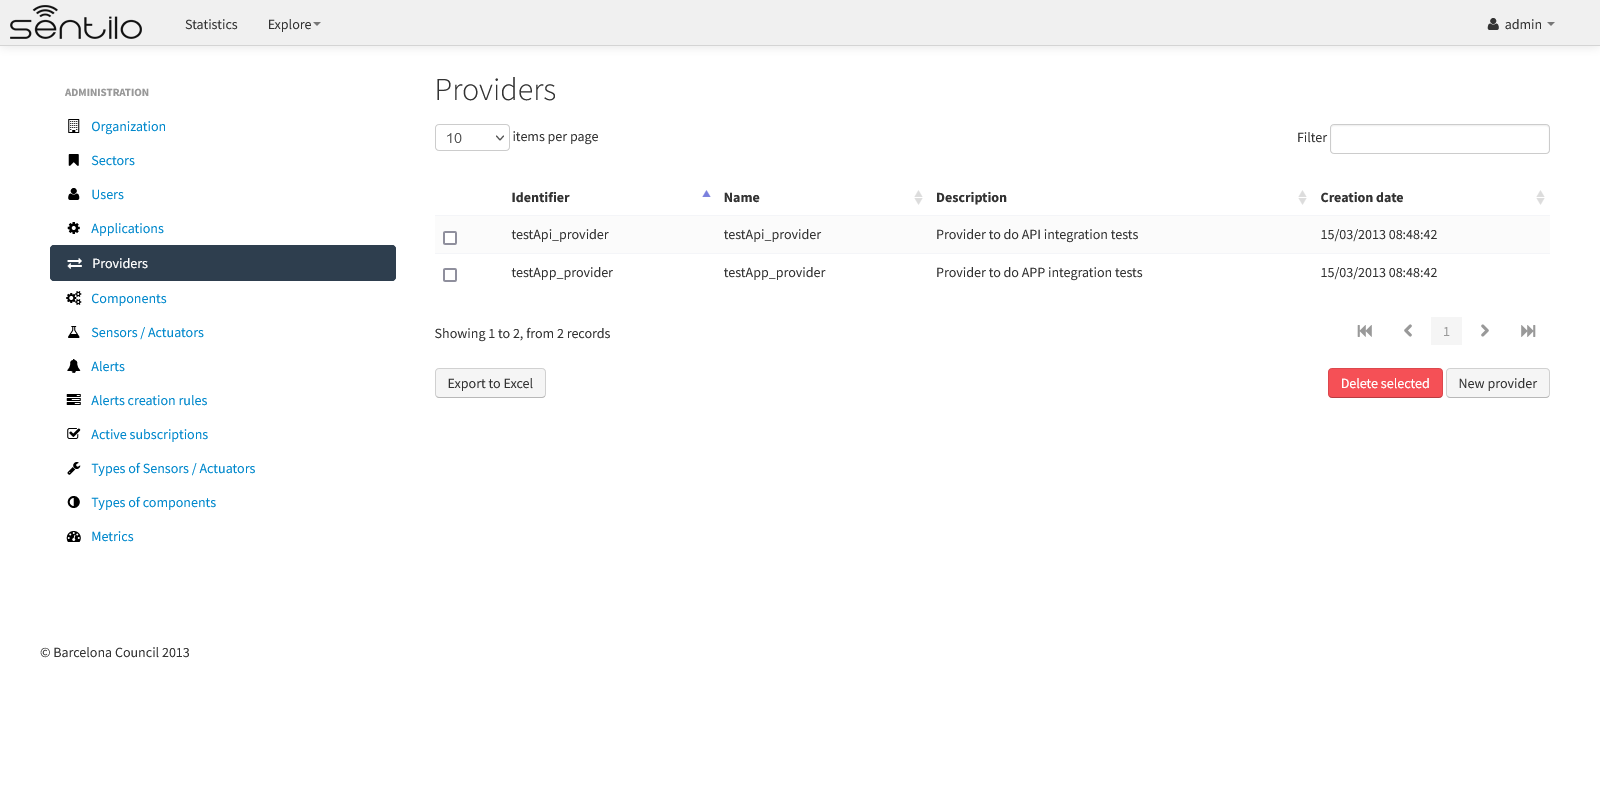
List
Access the Providers list. This is the main Provider page. From here you’ll can access to the desired provider to show its details by click on it.
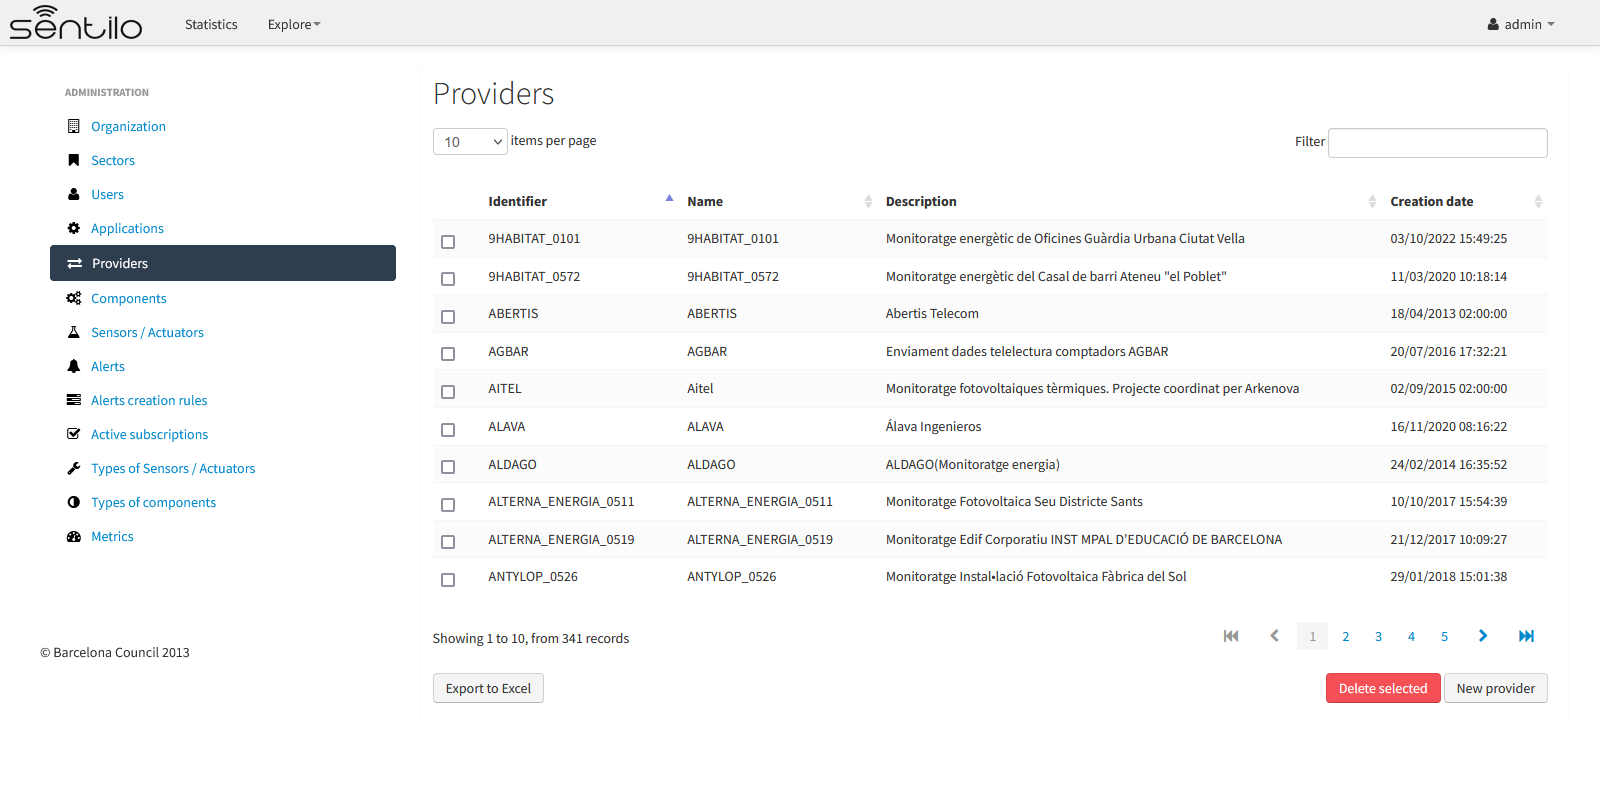
You’ll be able to list, filter, show provider details, create (New provider button) and delete selected providers (select from left checkbox, and apply by Delete selected button).
Further, you’ll be able to export the list to Excel, by clicking on Export to Excel button. The result file will contain the list columns and a number of extra ones from internal database use.
Use the button panel at the bottom right to navigate through the list (first page, previous page, page number, next page and last page, respectively).
Details tab
The detail page of a provider is structured into five tabs:
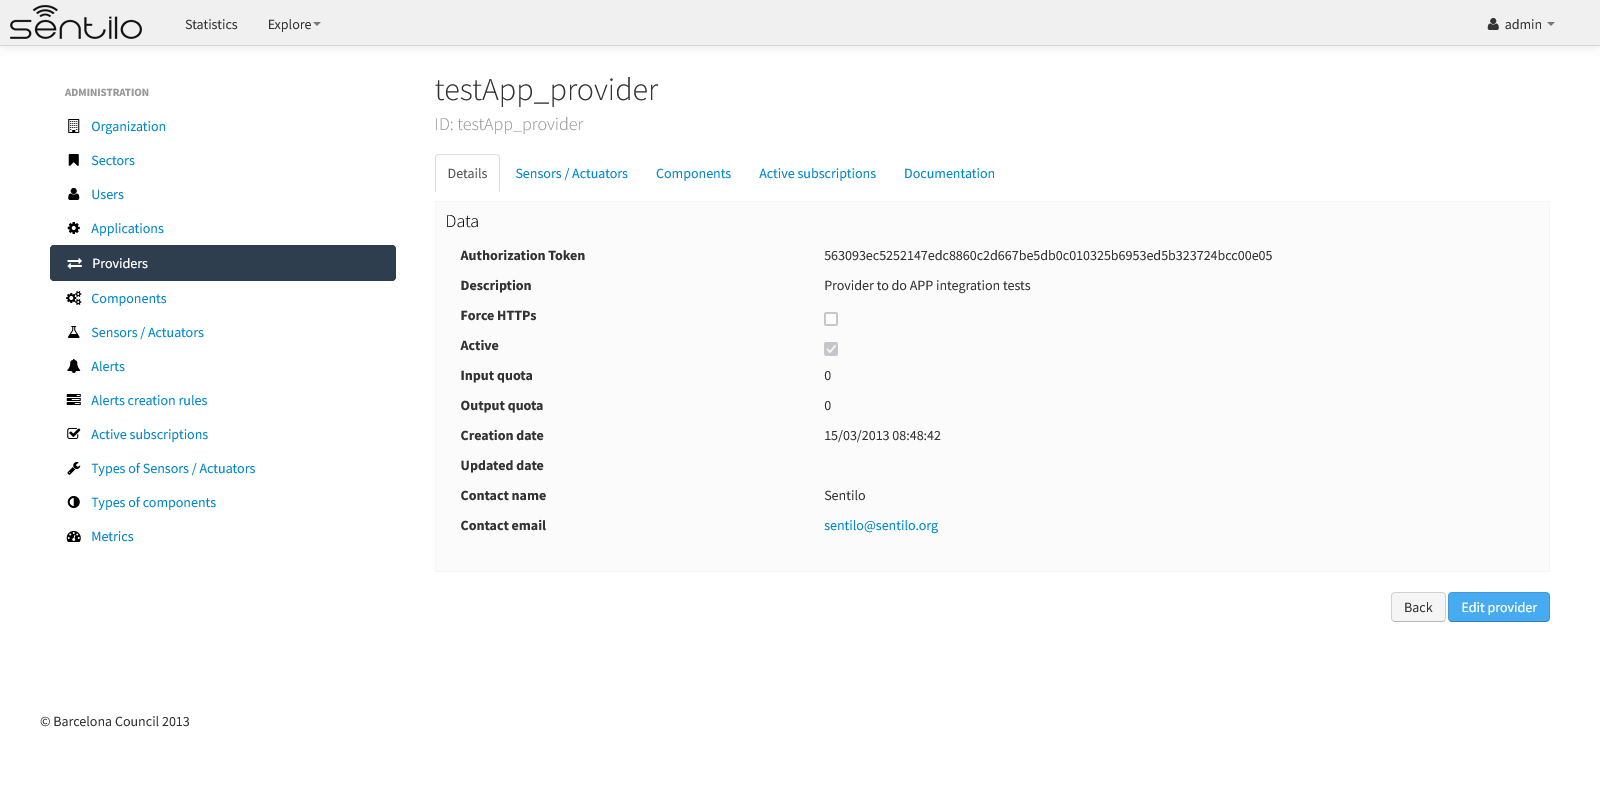
where
- The Details tab contains the main properties of the provider (described below).
- The Sensors/Actuators tab displays a list with all sensors owned by the current provider (i.e. associated with this provider).
- The Components tab displays a list with all components owned by the current provider.
- The Active subscriptions tab displays a list with all the active subscriptions for the current provider.
- The Documentation In this tab you can upload any files relevant to provider, such as a maintenance guide, etc.
The main properties of the Details tab are the following:
| Property | Description | Comments |
|---|---|---|
| Identifier | Provider identifier | Mandatory. After its creation can’t be modified. It is the identifier used in the API calls. |
| Name | Display name | If not filled in by the user, its default value will be the Id. |
| Authorization Token | Access key | Automatically generated by the system when application is created. It is the* identity_key* value used in the API calls. NOTE: only users with ADMIN role will show the entire token chain, other user roles only will see obfuscated text at this place (see below) |
| Description | Description | Optional. The provider description text. |
| HTTPS API REST | Provider sends data over HTTPS | The Sentilo Server itself does not support SSL at the moment, however you can put a reverse proxy such as Nginx in front of the Sentilo Server. If this option is checked, the Sentilo Server expects the standard header X-Forwarded-Proto
Please note that when configuring Nginx, you should also use the parameter underscores_in_hea
ders on;
so Nginx would forward sentilo headers to the Sentilo Server. |
| Contact name | Name of the person responsible for the provider | Mandatory |
| Contact email | Email address of the person responsible for the application | Mandatory. |
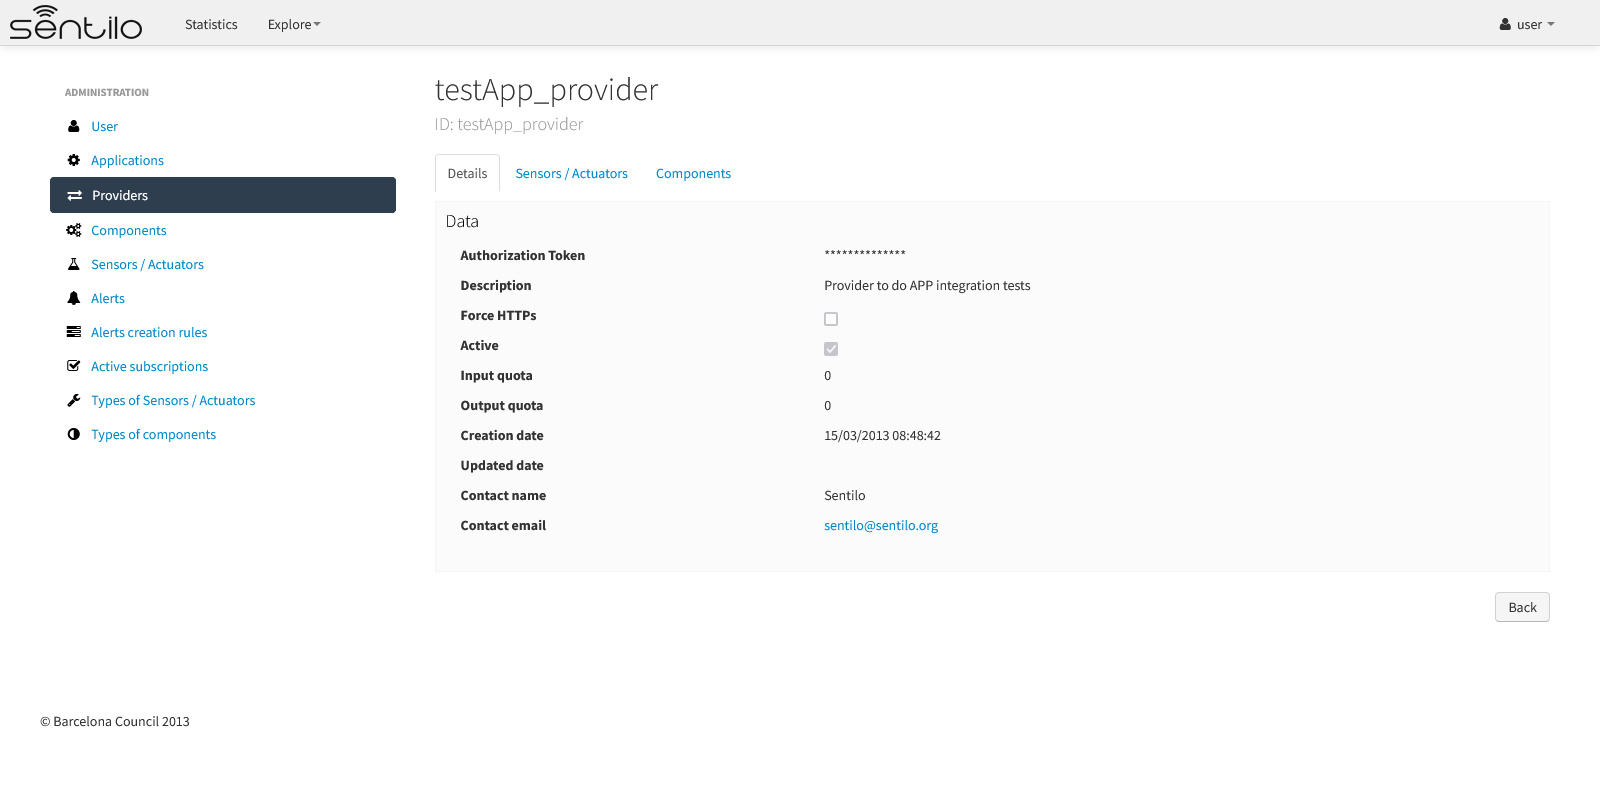
How users that has not ADMIN role see the detail section:
Sensors/Actuators tab
As mentioned before, this tab displays a list with all sensors associated with the current provider, as shown in the picture below where the sensors of the provider CINERGIA are listed:
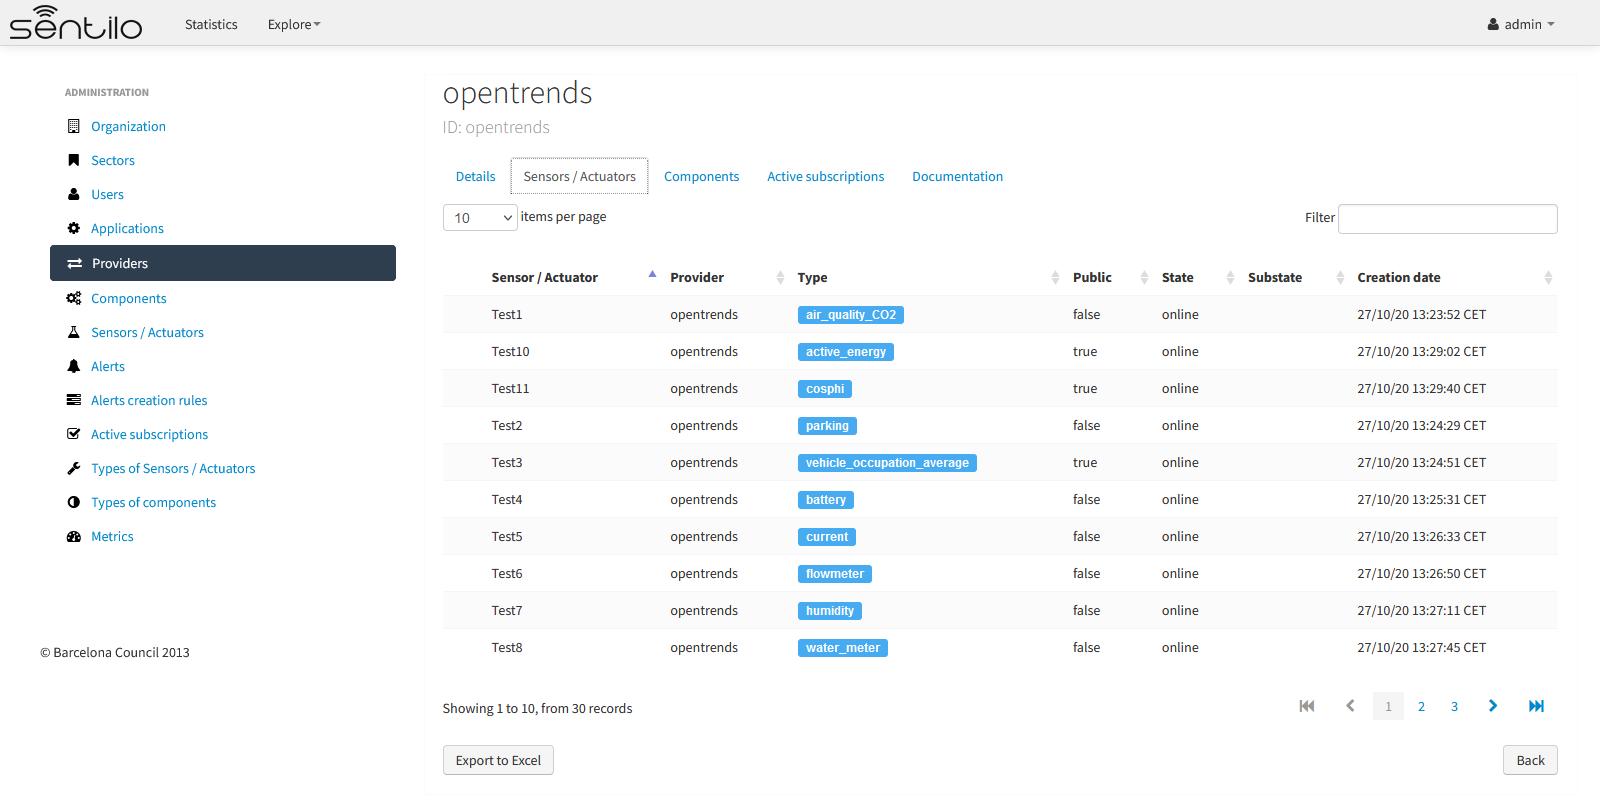
You could filter, page and order the list but you cannot access to the sensor detail: it must be done from the sensor list administration.
Components tab
As explained early, this list is very similar to the previous one but with components.
Active subscriptions tab
The meaning of this tab is the same as described for the applications.
Documentation tab
In this tab you can upload any files relevant to provider (up to 4MB each). The documents in total should not surpass ~16MB, which the limit of MongoDb.
Sectors
In Sentilo, resources are managed through applications and providers, globally, through an administrator user. In the case of a multi-tenant instance, in the same way, it will be the entity’s administrator user who will be able to manage said resources, but only within his own entity.
But you can also do this using resource groups. It is the management called “by sectors” or “delegated administration”. In this type of administration, one or more users are given the ability to manage a group of resources, called a “sector”, so that the responsibility does not always fall on a single administrator. In this way, a user becomes a sector administrator when they are associated with a resource group or sector.
List
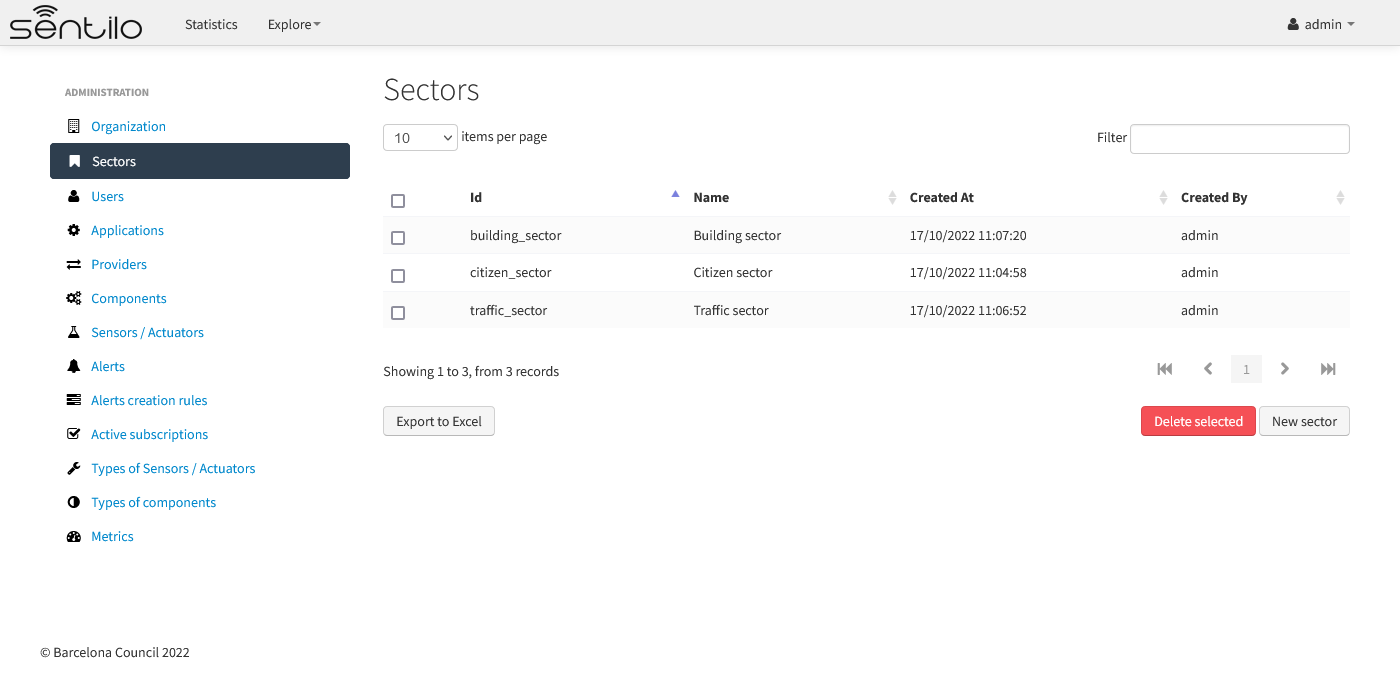
For example, we can divide all the resources and devices, of a Sentilo entity or instance, into several groups that unify their purpose. In the example above we can see three groupings: buildings, citizens and traffic. This type of partitioning could describe a small pool of resources in a smart city that Sentilo has access to:
- buildings: smart building data processing
- citizens: treatment of the use of roads, detection of passage and occupation of streets and avenues
- traffic: treatment of the occupation and use of public roads on which vehicles circulate, detection of passage, capacity of vehicles, etc…
In short, we will call a “sector” to a group of applications, providers and all the resources that they encompass, and that can be managed by one or more users.
A sector is defined by its identifier, its name and its description:
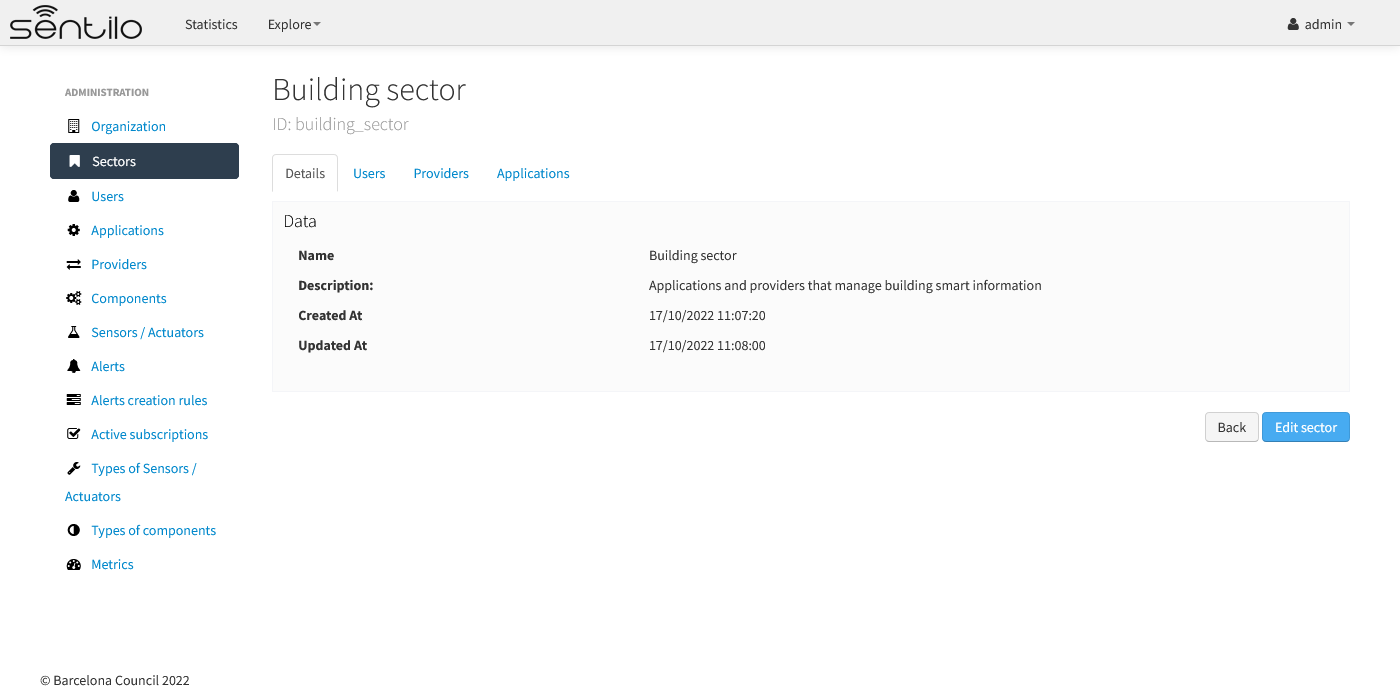
| Id | Name | Description |
|---|---|---|
| Id | Sector identifier | After its creation can’t be modified |
| Name | Sector name | |
| Description | Sector description |
The date and time of creation and modification are generated automatically.
Sectors can only be created and managed by admin users:
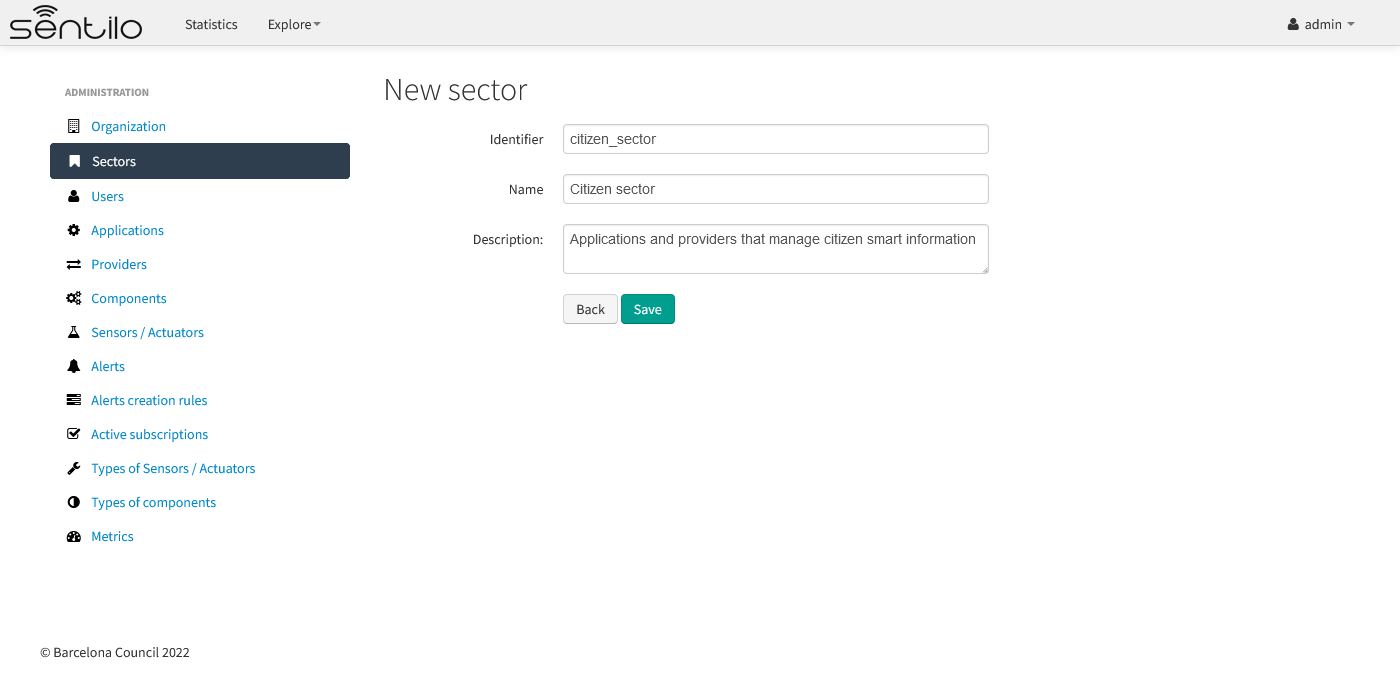
then:
Sector users
The users of a sector are added from the “Users” tab.
Click on “Add” and then a modal popup will appear:
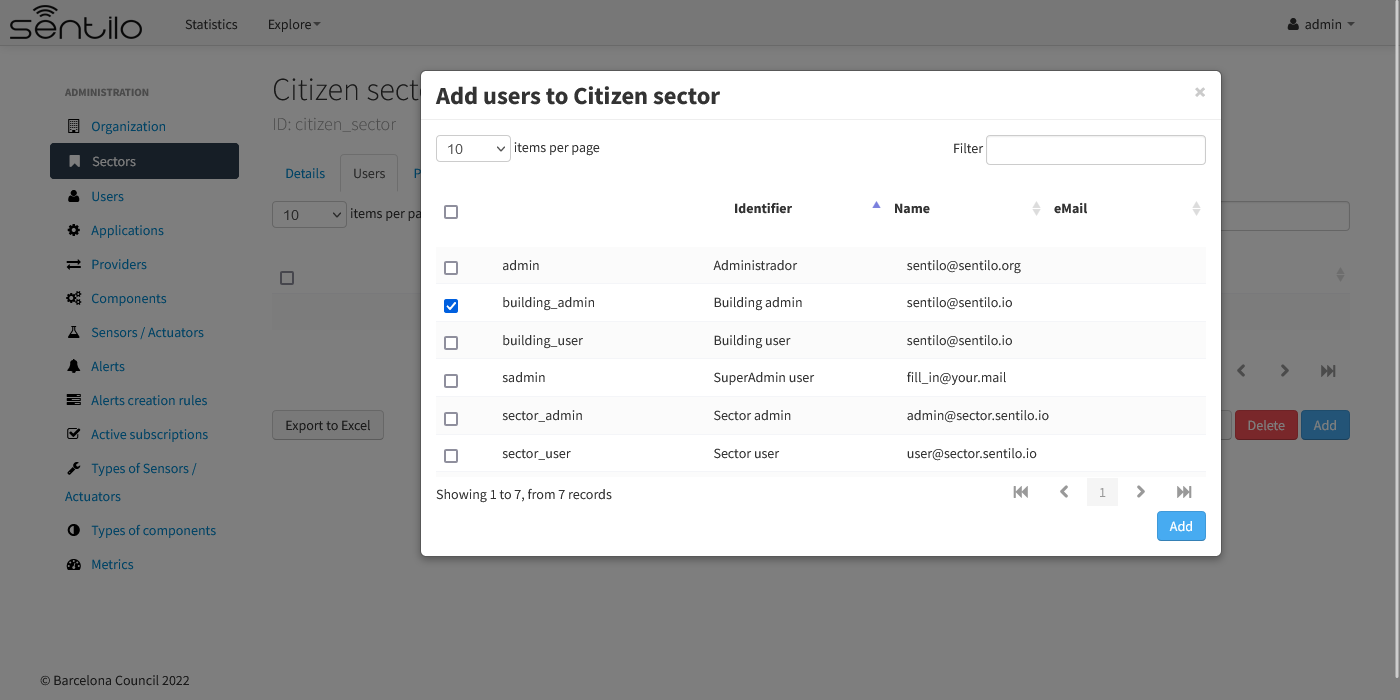
From this window we can add one or several users, registered globally in the instance, as administrators of the sector. In the case of multi-tenant, we can only add users from our own entity.
Sector providers
They are found in the “Providers” tab, and they are the providers that a sector can manage.
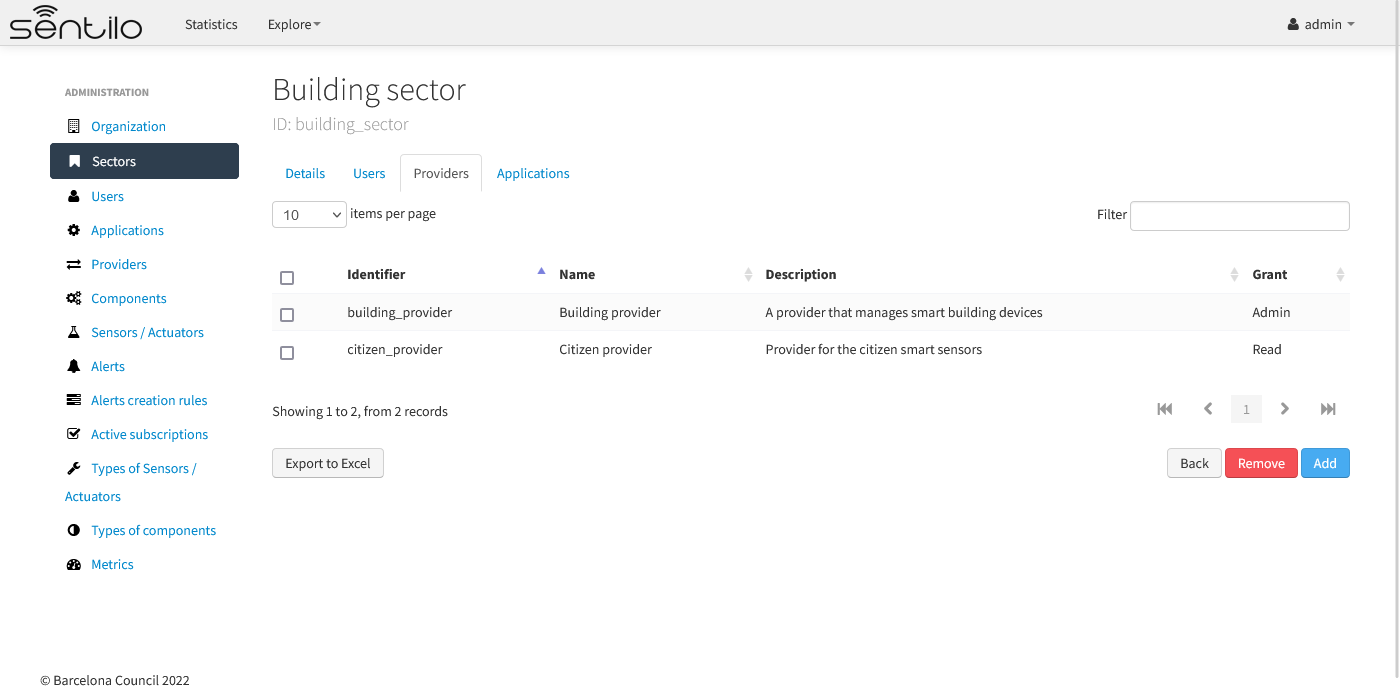
To add or remove providers to the sector, we must access the tab and click on the add or remove buttons, as needed.
To add a provider to the sector, we will click on the “Add” button, and a modal popup window will appear from which we can select the provider and the level of access we wish to grant (read only, or administration):
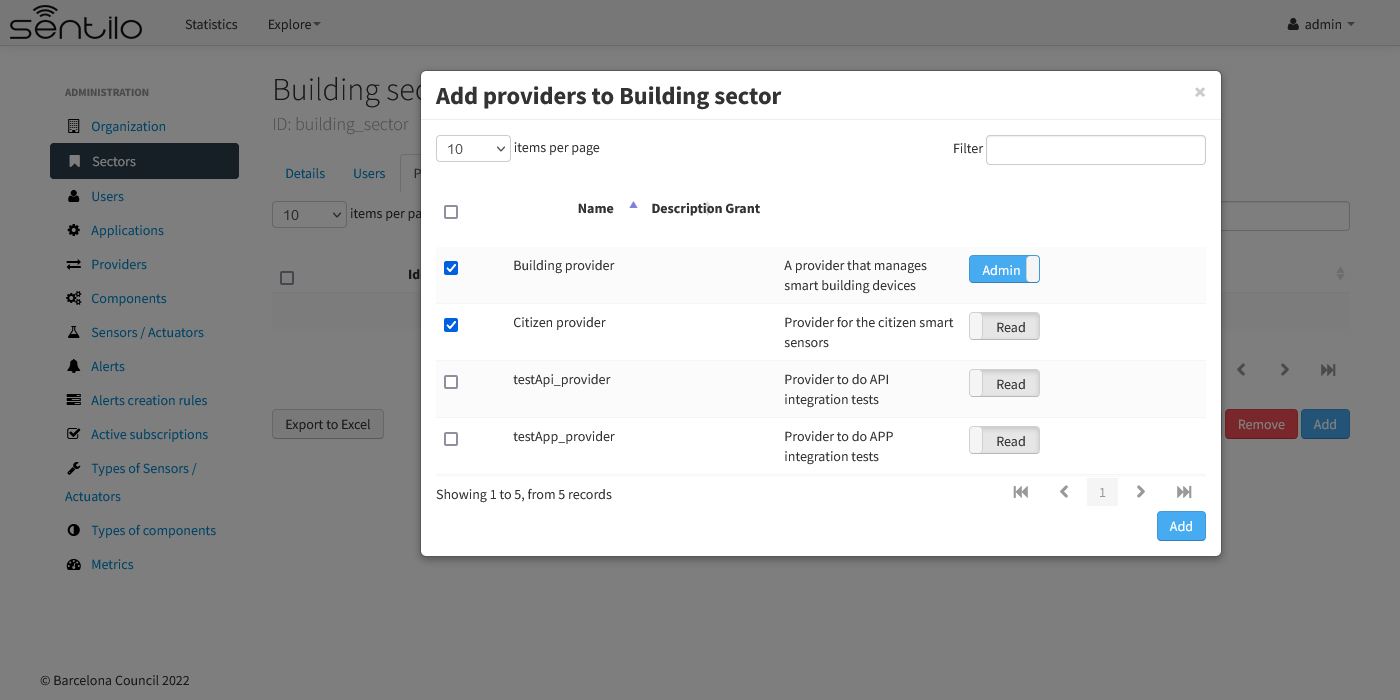
From now on, the sector will be able to manage these providers with the level of permissions selected.
Sector applications
They are found in the “Applications” tab, and they are the applications that a sector can manage.
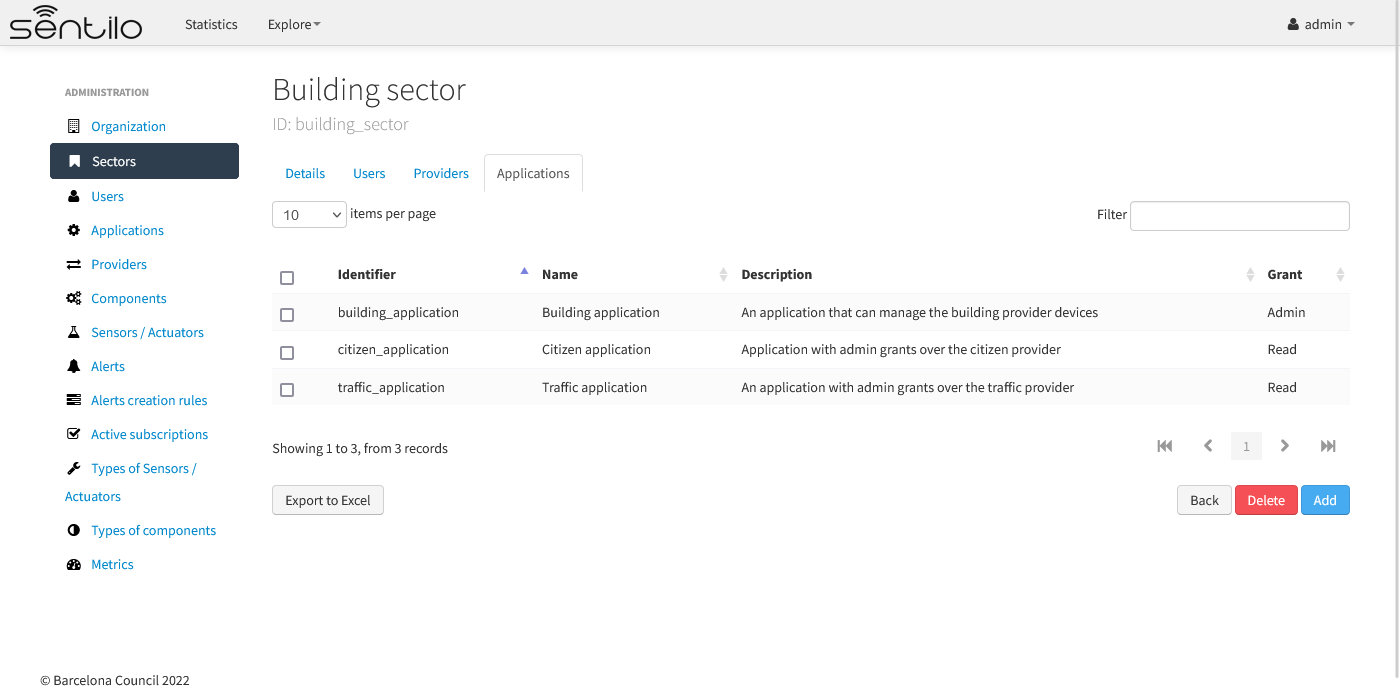
To add or remove applictions to the sector, we must access the tab and click on the add or remove buttons, as needed.
To add an application to the sector, we will click on the “Add” button, and a modal popup window will appear from which we can select the applications and the level of access we wish to grant (read only, or administration):
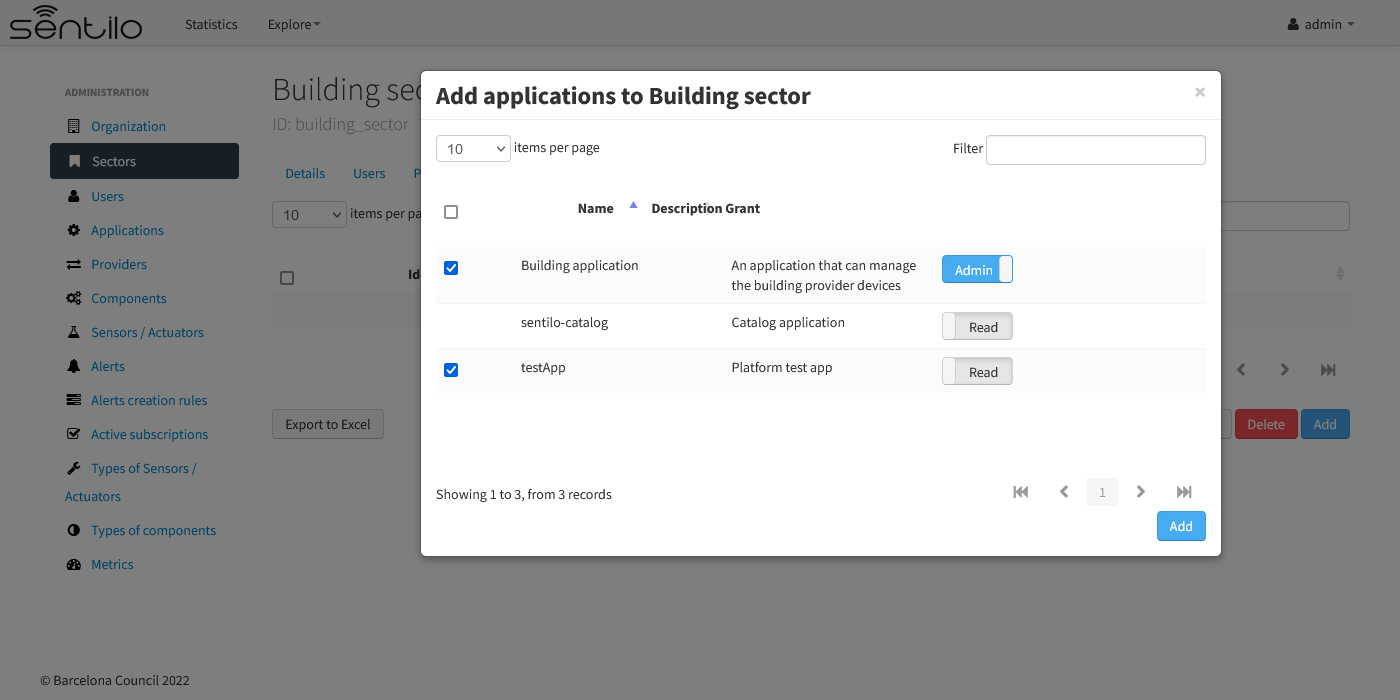
From now on, the sector will be able to manage these applications with the level of permissions selected.
Access as sector user
Since a user is added to a sector, this user will only be able to see the resources that were added to that sector.
Let’s remember the user “building_user”.
This is how we would see the detail of the user:
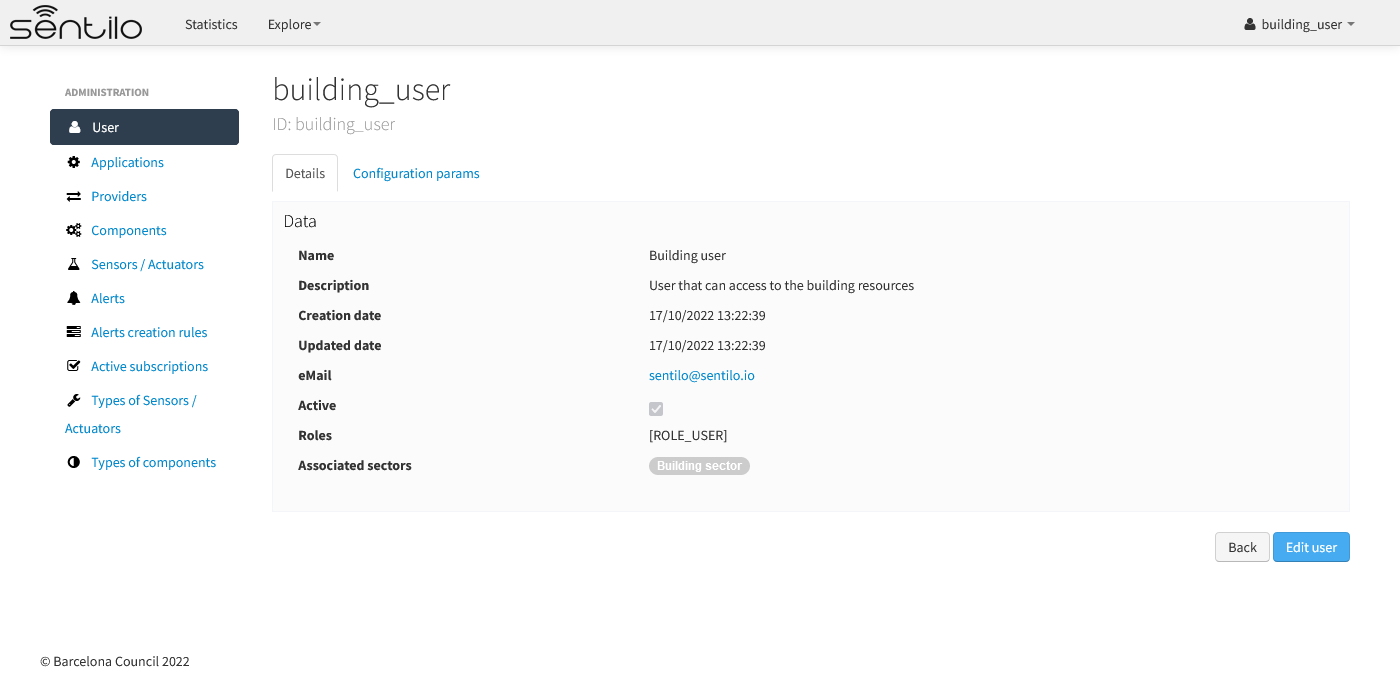
Notice the last parameter, named “Associated sectors” which indicates to which sectors it belongs.
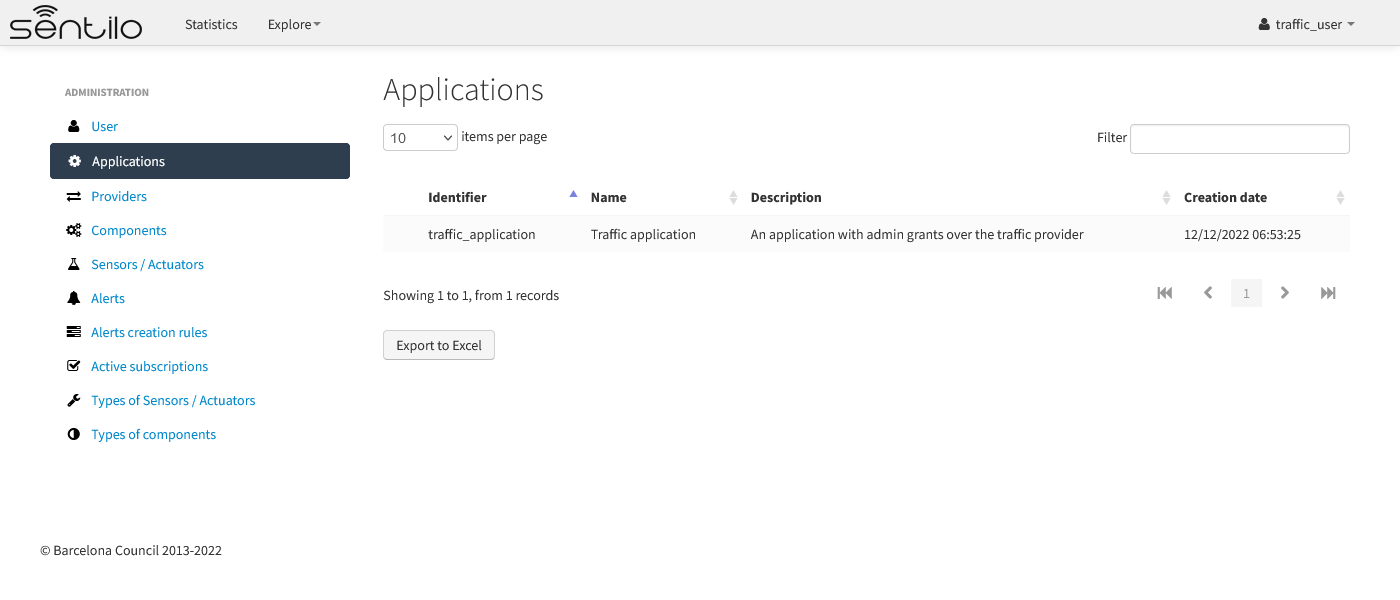
Therefore, if we access the lists of providers and applications, we can only see those resources that have been assigned to us to be managed within our sector, and their granted permissions:
Applications list
Providers list
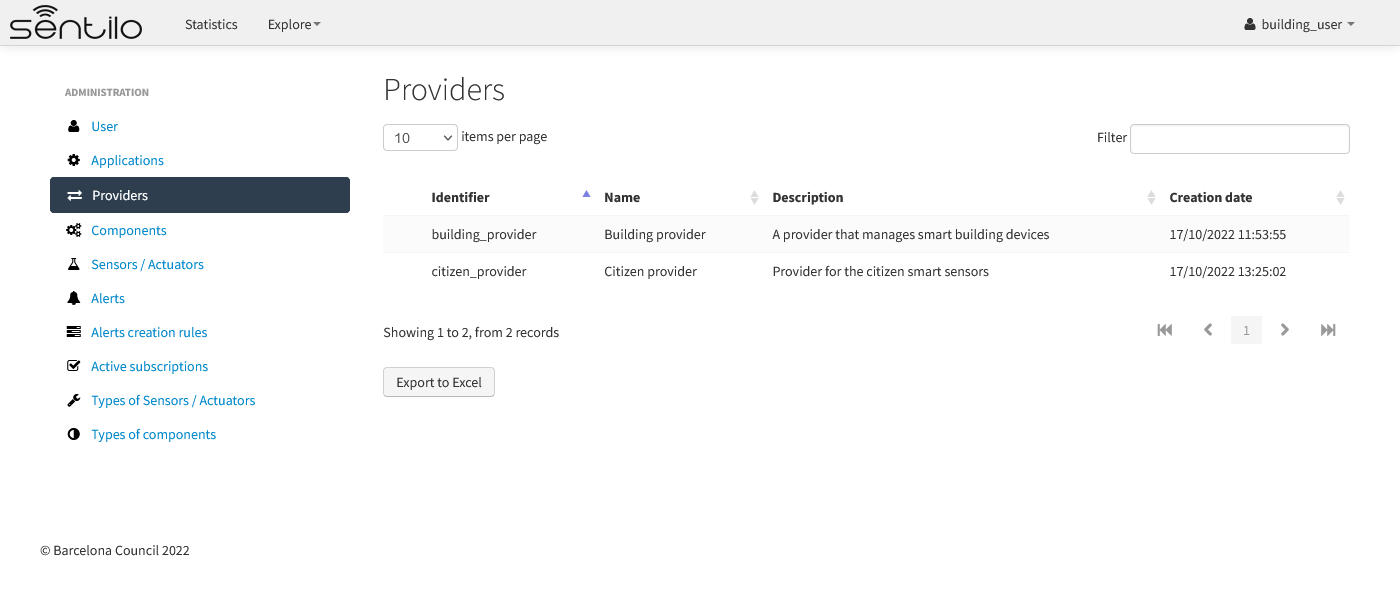
From this moment on, the user of the sector will be able to manage the resources of the sector with the previously granted permissions.
Components
Within the context of Sentilo, components have a special meaning: they are not linked to the API REST (except for the catalog service), i.e., components are not required to publish or read data. We use components in Catalog to group together sensors sharing a set of properties, such as location, provider, power or connectivity.
You could think of them as physical devices with a set of sensors, like a weather station or a microcontroller, with multiple sensors connected. But not necessarily a component needs to have sensors physically connected to it. A gateway could also be modeled as a component: you could have a wireless sensor network (WSN) where each sensor sends data to a gateway and then it sends data to Sentilo using its Ethernet/WiFi/.. connection . In this case, the gateway will also be a component. And finally, if you have a sensor that connects to Sentilo directly then you will have a component with only one sensor.
In short: in Sentilo, a sensor always need to be related to a component and providers have its sensors grouped by components, as shown in the following picture:

List
One singularity of the components list page are the two buttons that allows us to change the visibility of a set of components from public to private and vice versa. These buttons apply on the selected rows.
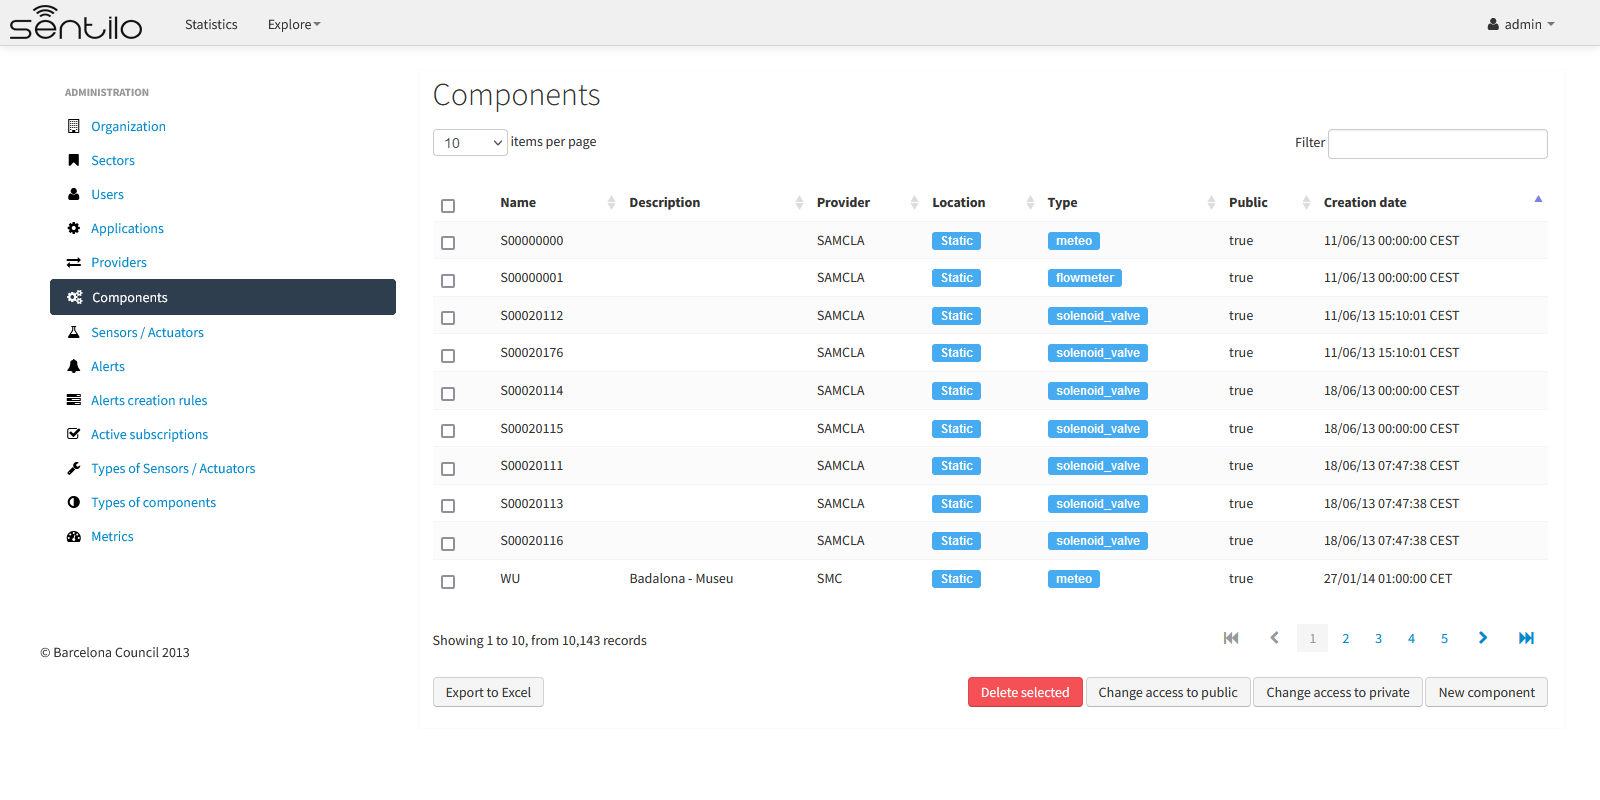
You’ll be able to list, filter, show components details and create (New component button). Like with the providers list, the component list have a Delete button that works as follows:* if you remove a component, not only the component will be deleted from the backend, but also all its related resources will be deleted* such as sensors, alerts … and any data published by its sensors, so be very careful with this command.
Further, you’ll be able to export the list to Excel, by clicking on Export to Excel button. The result file will contain the list columns and a number of extra ones from internal database use.
Use the button panel at the bottom right to navigate through the list (first page, previous page, page number, next page and last page, respectively).
Details tab
The detail page of a component is structured into five tabs:
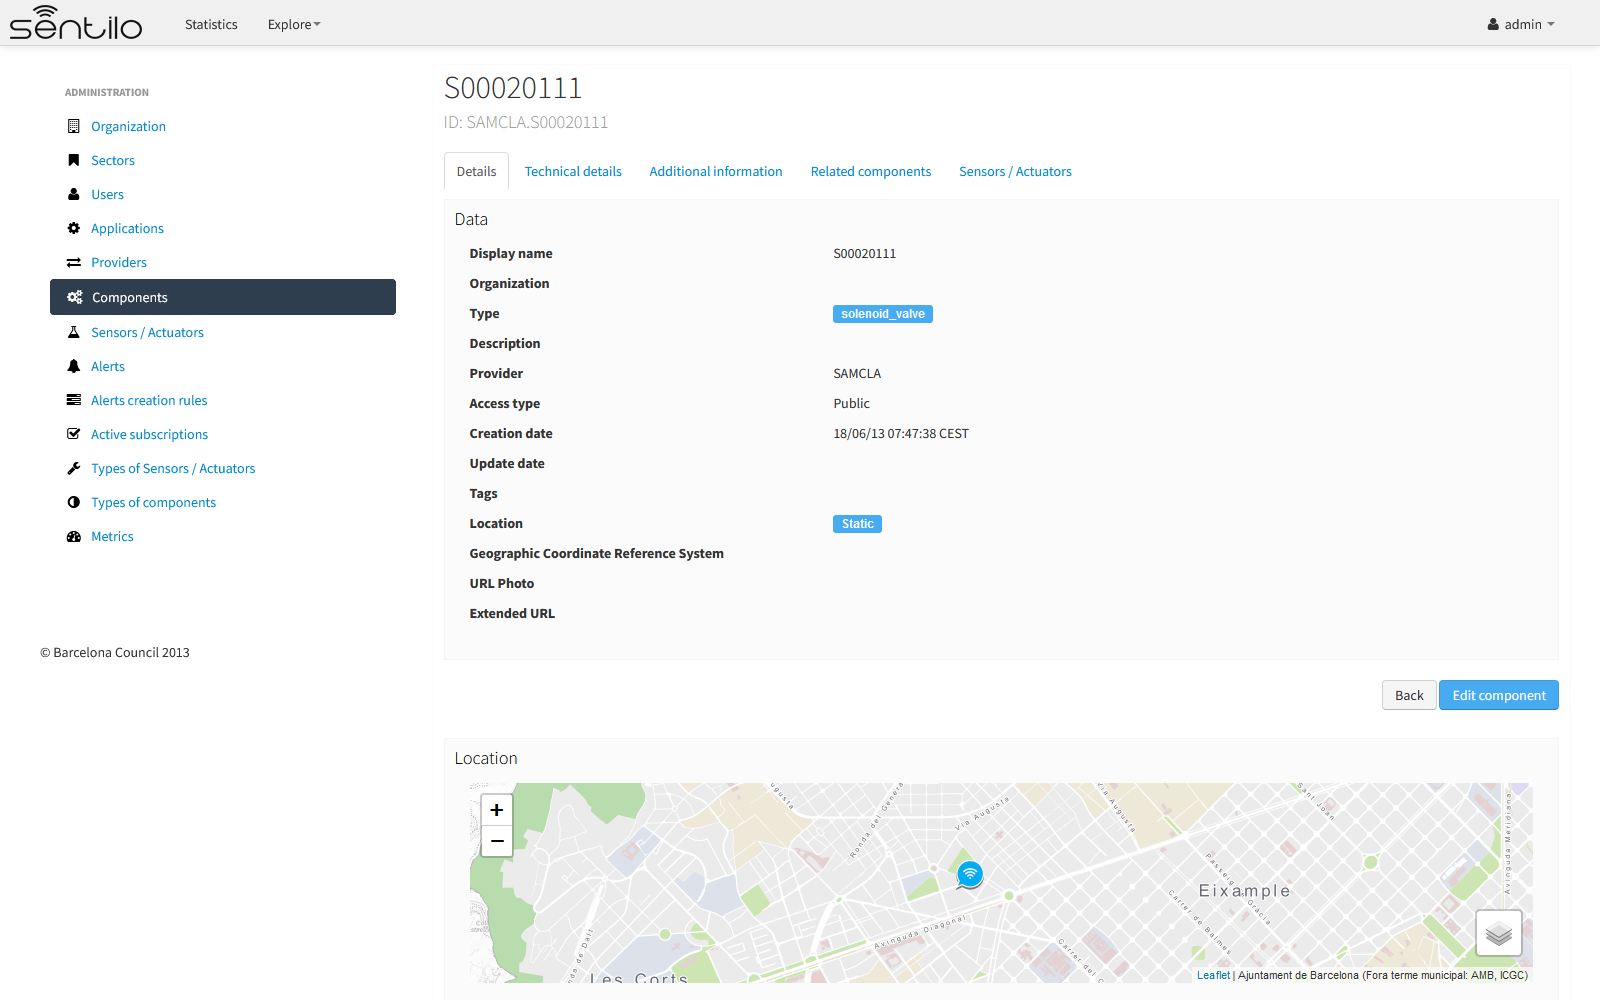
where:
- The Details tab displays the main properties of the component.
- The Technical details tab displays several categorized properties of the component.
- The Additional information tab displays custom properties of the component which are not predefined by Sentilo. See the parameter additionalInfo of the API docs
- The Related components tab shows other components linked with the current component .
- The Sensors/Actuators tab shows the sensor element located in the current component.
The main properties of the Details tab are the following:
| Property | Description | Comments |
|---|---|---|
| Name | Display name | Mandatory. After its creation can’t be modified. It is the identifier used in the API calls. |
| Type | Component type. | Mandatory. Select from a list of available types. |
| Description | Description | Optional. The component description text. |
| Provider | Component owner | Mandatory. |
| Photo URL | URL of the component photography | It could be defined for each component or it will be inherited using the defined one for the component type. |
| Extended URL | Define an external details page for the component type | Here you can inform an external url that will replace the default details component page |
| Access type | Checkbox to set the component visibility as public or private in the viewer | |
| Creation date | Creation date | Automatically generated |
| Update date | Last update date | Automatically generated |
| Tags | Related custom tags of the component | Are displayed at the public page |
| Static or Mobile | To mark the component as static or mobile | If the component is static then location is mandatory |
| Address | Address where the component is located | The address, longitude and latitude fields work together with the location list field. It’s possible to use the map to set the points adding new locations. |
| Latitude | Latitude in decimal format | |
| Longitude | Longitude in decimal format | |
| Locations List | Location/s of the component | You can configure the component as a POI, a polyline or a polygon (future feature) depending the location composition. |
Technical details tab
As noted above, this tab displays a set of properties related to the technical details of the component such as manufacturer, serial number, ….
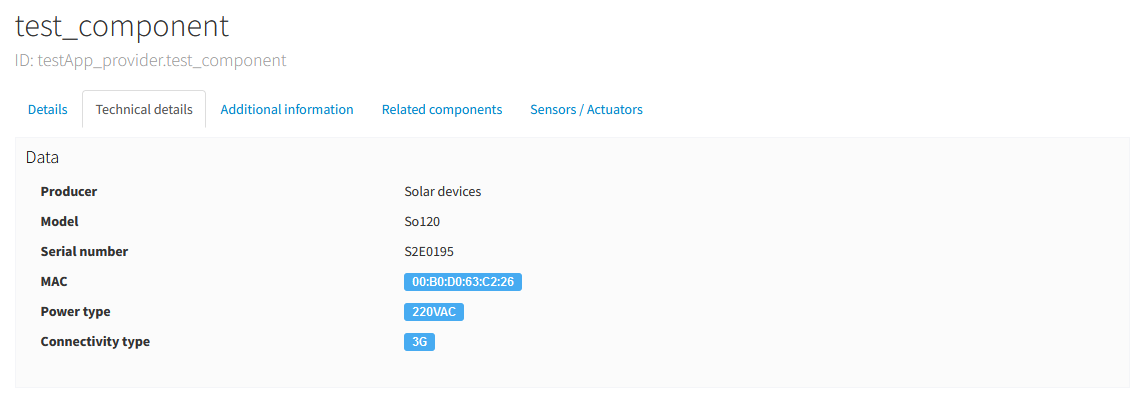
where:
| Property | Description | Comments |
|---|---|---|
| Producer | Manufacturer | |
| Model | Component model | |
| Serial number | Serial number | |
| MAC | Mac address of the device | |
| Power type | Energy type used by the device | Select from a list of available values (see the API for details) |
| Connectivity type | Connection type used by the device | Select from a list of available values (see the API for details) |
Additional information tab
This tab displays the set of additional properties related to the component. See the parameter componentAdditionalInfo of the API docs.
These fields are not categorized, i.e., here you could stored any device information which will be of interest.
For each property, it will be displayed as a label-value entry where the property’s key will be the label and the property’s value will be the value, as shown in the following picture:
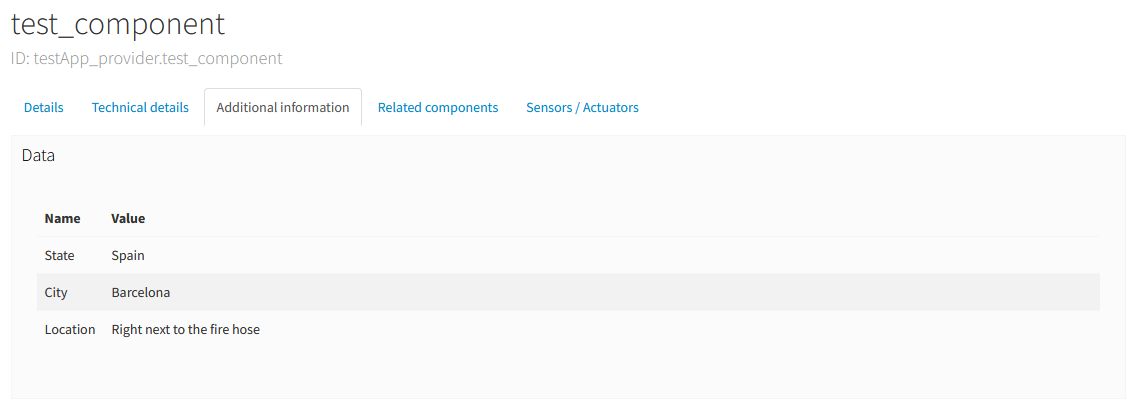
where the following map, stored on the backend, has been rendered
{
        “State”: “Spain”,
        “City”: “Barcelona”,
        “Location”: “Right next to the fire hose”
}
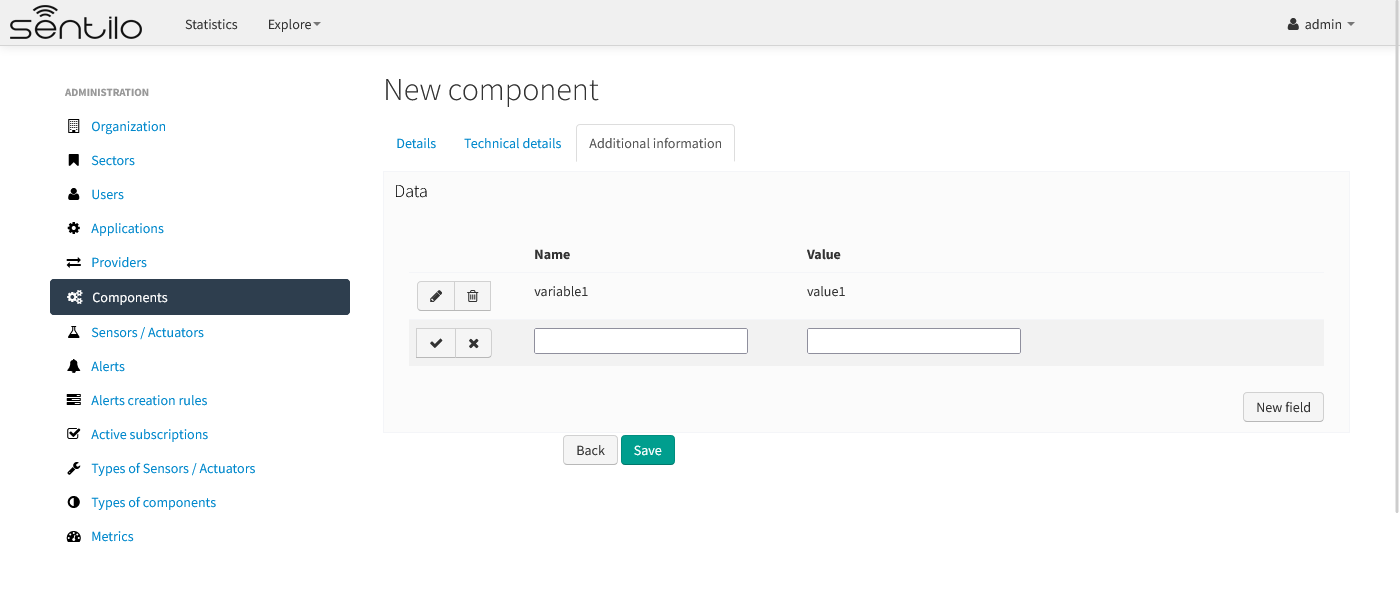
It is also possible to edit these parameters from the catalog application, in editing mode:
Sensors/actuators tab
The meaning of this tab is the same as for the providers, but restricted to the current component.
Sensors
These section is used for creating, updating or deleting sensors or actuators. Usually these elements are created by the provider autonomously using the API.
The sensors list page follows the same structure as described for components (you could change the public/private visibility or delete sensors massively through the list).
List
It is possible to full-text search the list in the “Filter” box. The filter works for all filter attributes except the creation date. The Filter field is case-sensitive. Only search by the substate’s code is possible at the moment.
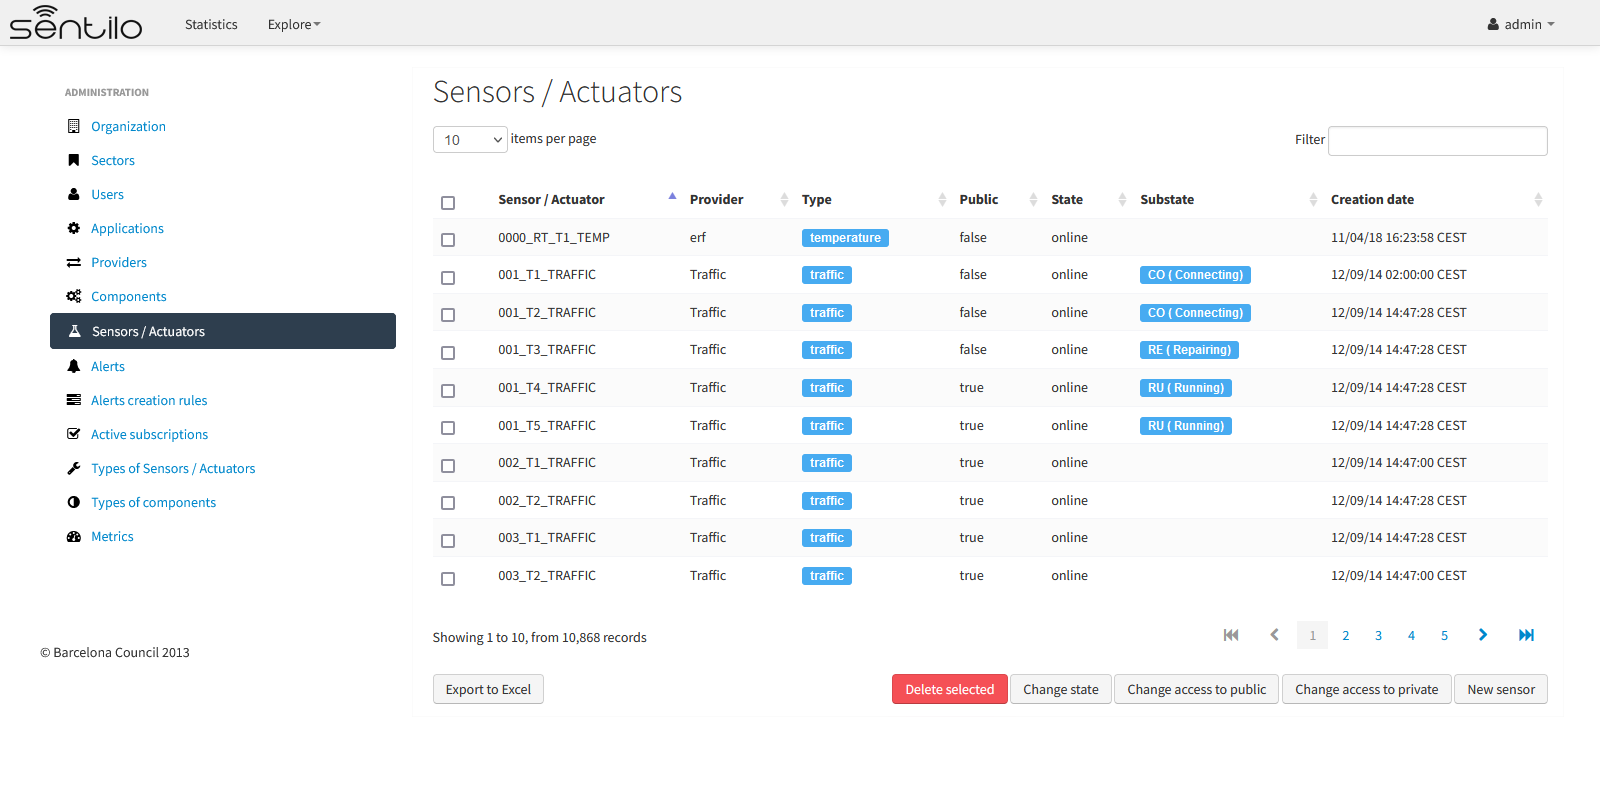
You’ll be able to list, filter, show sensors details, and create (New application button) and delete selected sensors (select from left checkbox, and apply by Delete selected button).
Further, you’ll be able to export the list to Excel, by clicking on Export to Excel button. The result file will contain the list columns and a number of extra ones from internal database use.
Use the button panel at the bottom right to navigate through the list (first page, previous page, page number, next page and last page, respectively).
Details Tab
The detail page of a sensor is structured into four tabs:
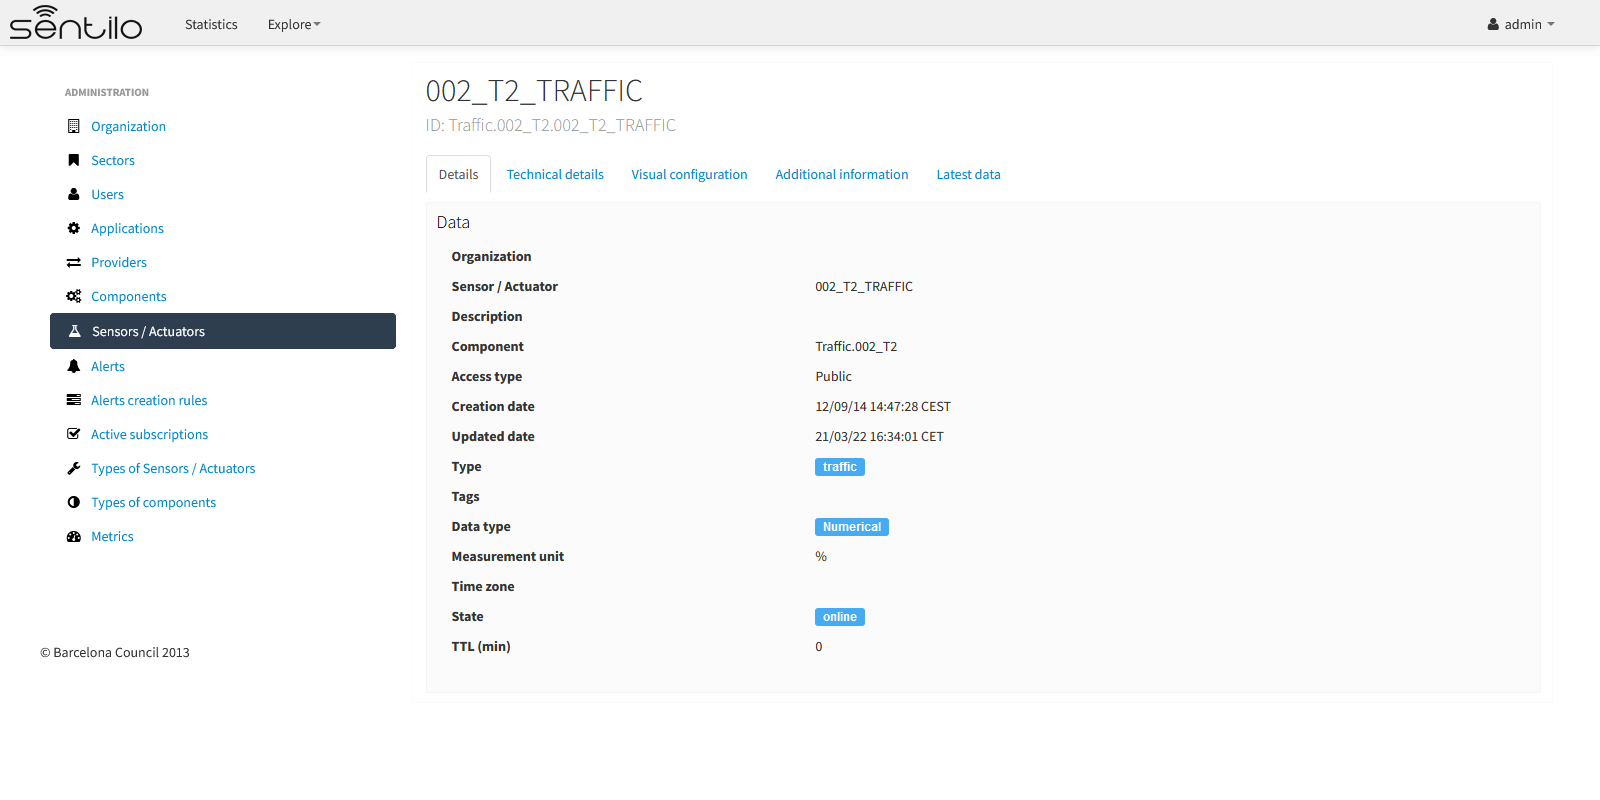
where
- The Details tab displays the main properties of the sensor.
- The Technical details tab displays several categorized properties of the sensor.
- The Additional information tab displays the custom properties of the sensor.
- The Latest data tab shows the latest observations received from the sensor.
The main properties of the Details tab are the following:
| Property | Description | Comments |
|---|---|---|
| Sensor / Actuator | Name of the sensor/actuator. | Mandatory. After its creation can’t be modified. It is the identifier used in the API calls. |
| Provider | Sensor provider owner | Mandatory |
| Description | Description | |
| Component | Component to which the sensor belongs | Mandatory |
| Access type | Checkbox to set the sensor visibility to public or private | |
| Creation date | Creation date | Automatically generated |
| Update date | Last update date | Automatically generated |
| Type | Sensor type | Mandatory. Select from a list of available types |
| Data type | Type of data published by the sensor | Mandatory. Possible values are:
|
| Unit | Measurement unit | |
| Time zone | Time zone for the data sent by the sensor | |
| Tags | Related custom tags of the sensor | |
| State | State of the sensor | Possible values: online | offline. If the sensor is configured as offline the API will reject any data publication, the alerts will be disabled and the sensor won’t be visible in the map. Likewise, offline sensors are excluded from the /catalog GET request. Default value is online. |
| Substate | Substate of the sensor | The list of possible values that have informational purpose and are specific for every deployment. You can customize the list of possible substate values editing the contents of table sensorSubstate in mongoDB. No default value. |
| TTL (min) | Time of expiration of sensor’s data in minutes | This value can be configured only from the catalog, Only admin should control this value. The default value is the sentilo.redis.expire.key.seconds parameter from the sentilo.conf file (expressed in secods) |
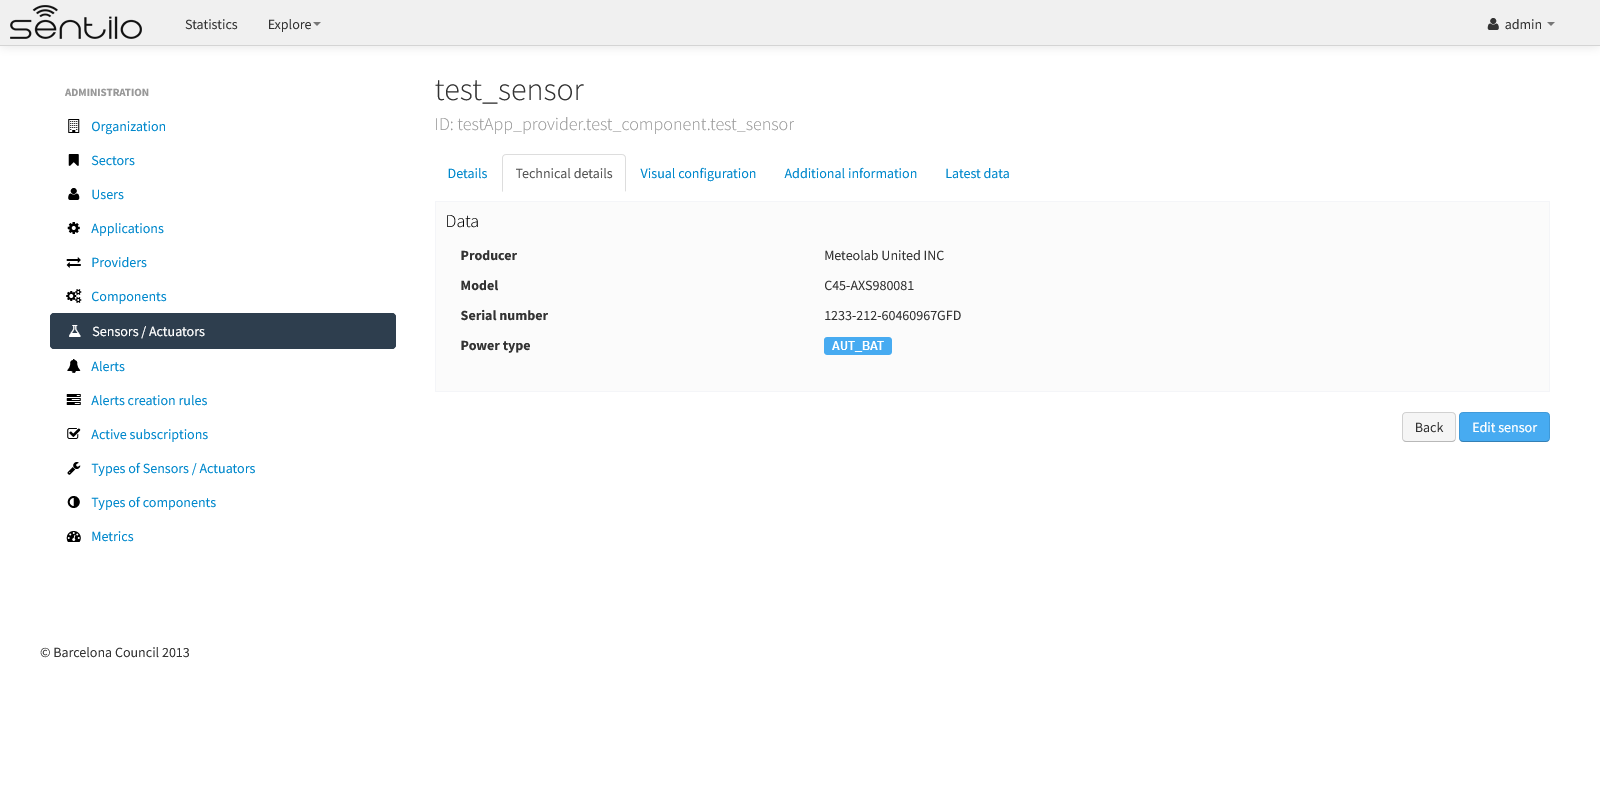
Technical details tab
As noted above, this tab displays a set of properties related to the technical details of the sensor ( such as the manufacturer, the model, the serial number and the power type , all of which are described in the component section) as shown in the following picture:
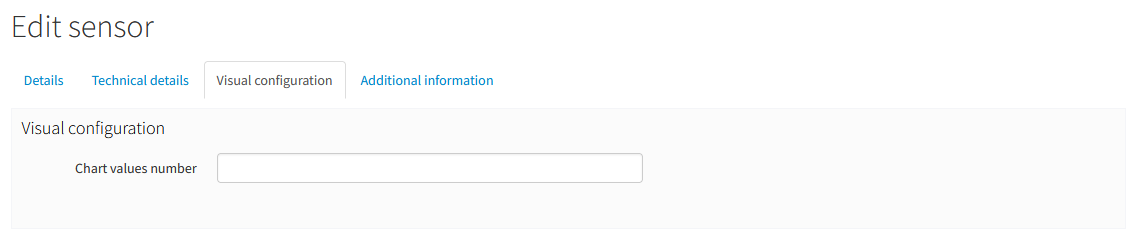
Visual configuration tab
The only configurable option in this tab is “Chart values number”. This integer indicates how many measures will be show in the observation chart of the sensor.
Additional information tab
The meaning of this tab is the same as for the components.
This tab displays the set of additional properties related to the component See the parameter additionalInfo of the API docs.
These fields are not categorized, i.e., here you could stored any device information which will be of interest.
For each property, it will be displayed as a label-value entry where the property’s key will be the label and the property’s value will be the value.
Once again, it is possible to edit them from the catalog as we have done with the component.
Latest data tab
This tab, as shown in the following picture:
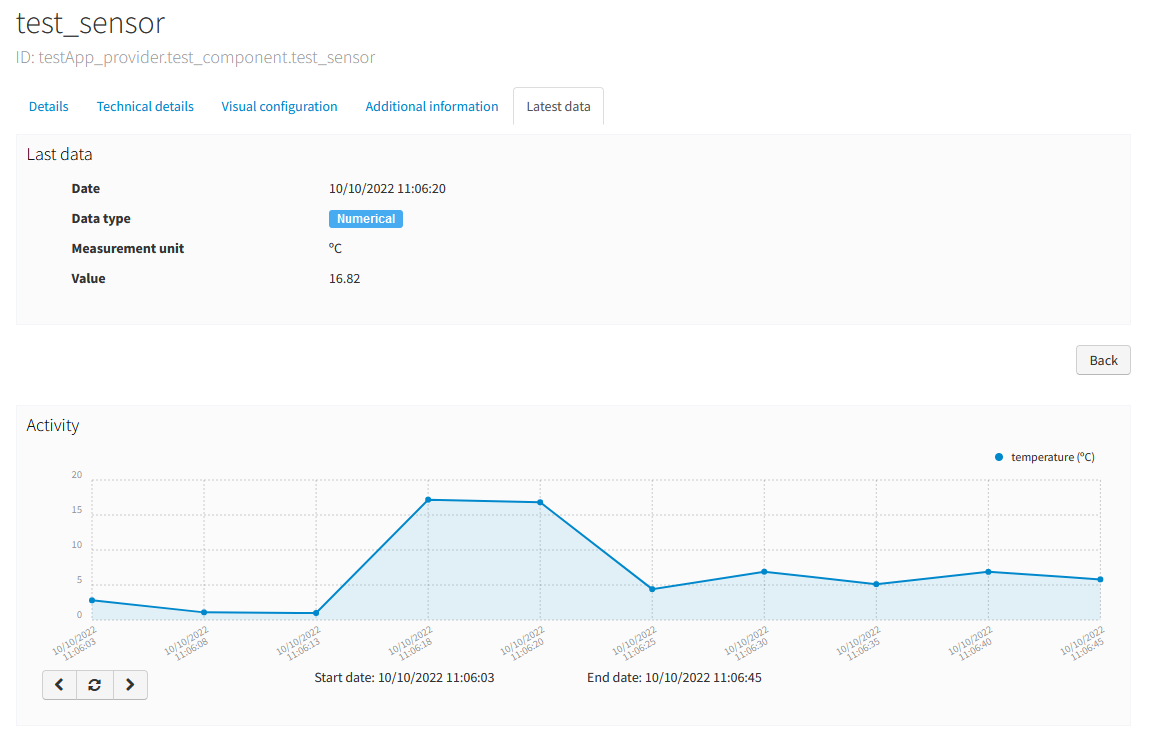
displays both the latest observation published by the sensor and a graph with its last activity.
You can navigate along the dates of the graph by using the buttons located in the lower right corner of it:

- left arrow: navigate to the past (only if there are older data)
- reload data (center button): reload last data / reset chart data
- righth arrow: navigate to the future (only if you have navigated or gone into the past before)
Number of chart observations at chart
You can change the number of values shown in the graph. To do this, within the sensor editing tabs, go to “Visual configuration”, and there edit the value of the “Chart values number” field
You must inform a positive value number. If blank, then default value shall be applied as that has been configured in the organization visual configuration.
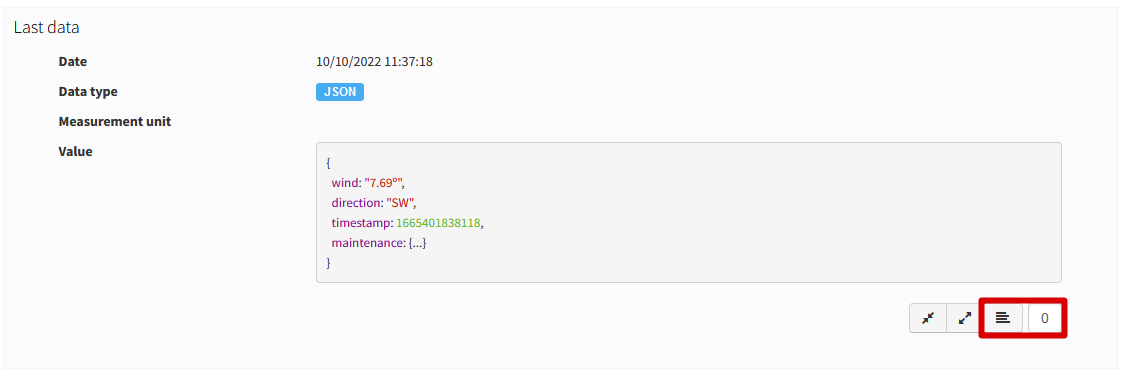
Showing complex data
If your sensor data type is text, and it contains a complex data in json format, Sentilo will show it as a prettified value:
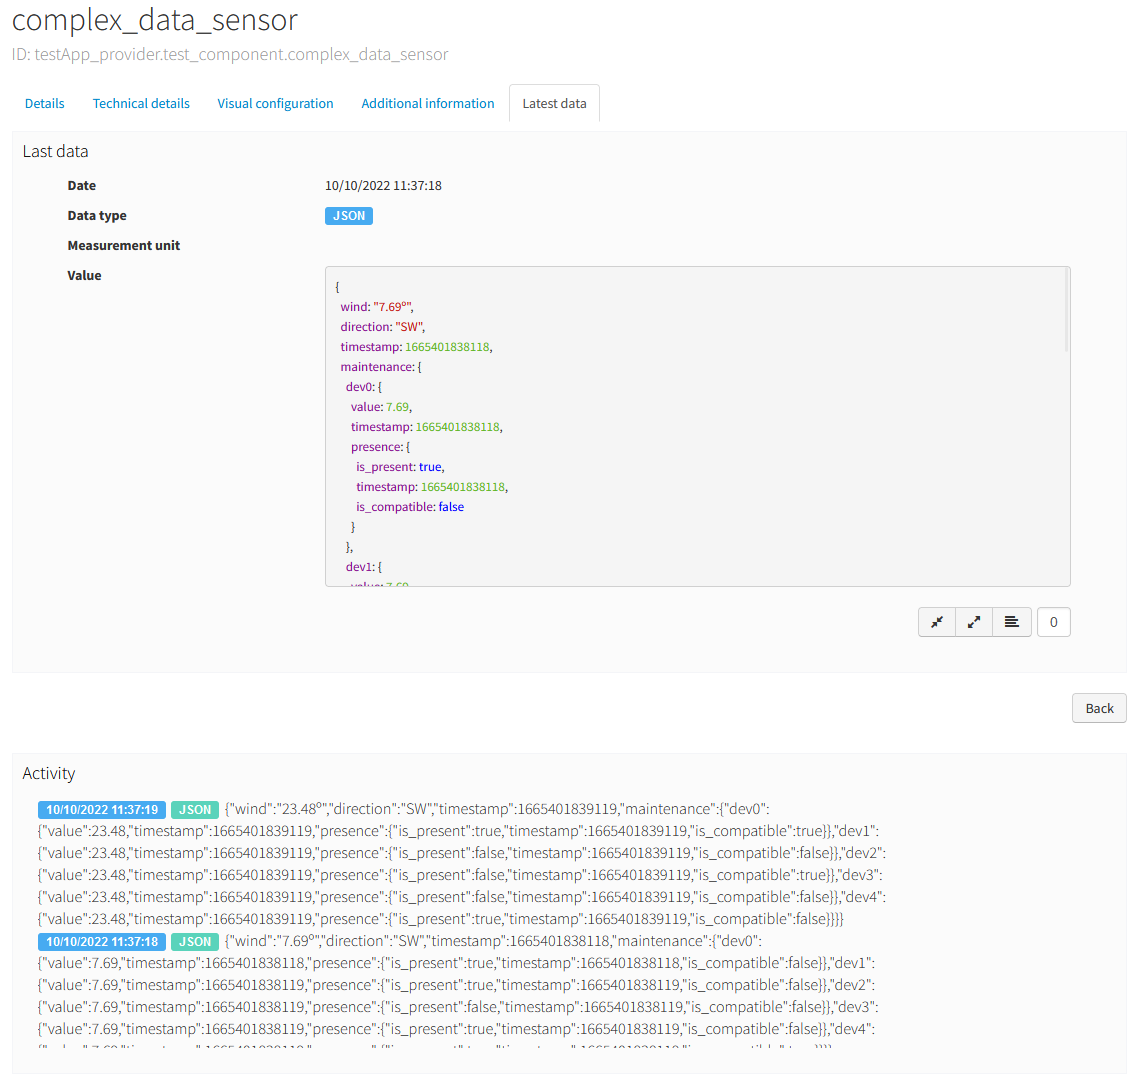
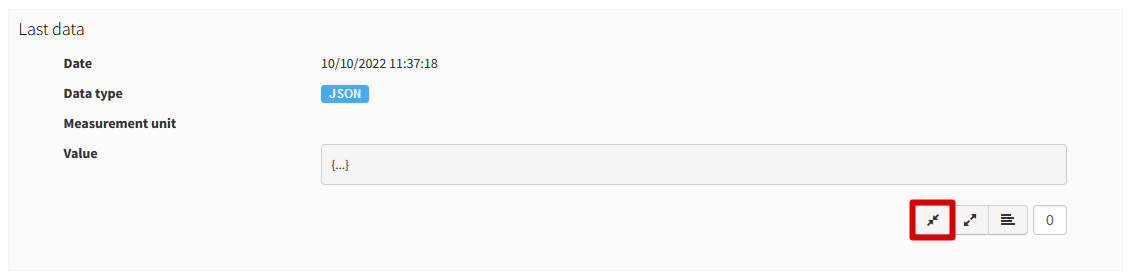
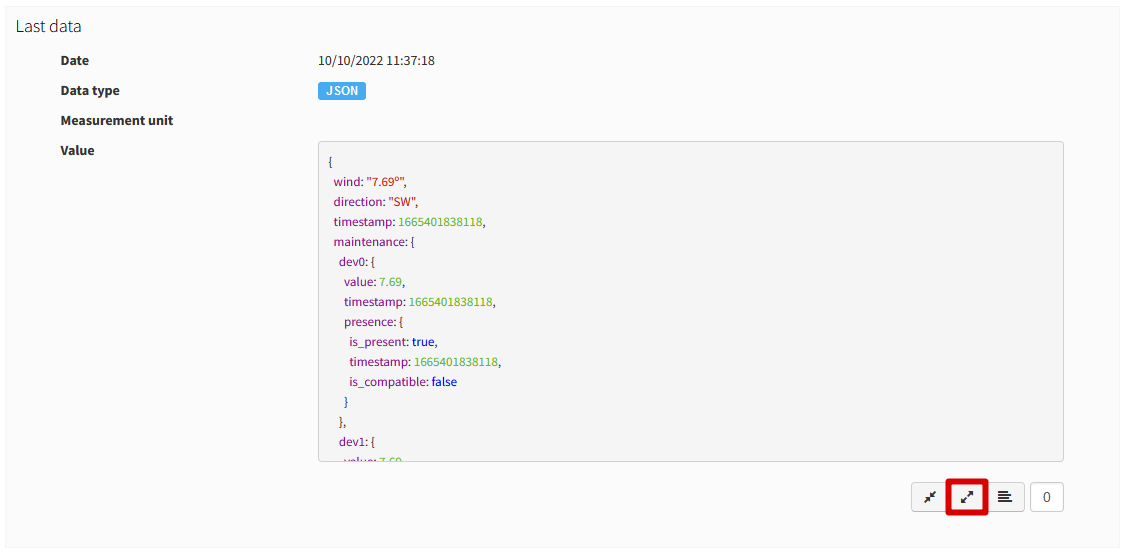
in this case you will have the possibility to inspect, expand or contract the json map shown as a value using the navigation buttons:
Collapse data: the json map will be collapsed at all
Expand data: the json map will be expanded at all (default view)
Collapse to level X: insert a correct value for the X, and click the button to collapse to the specified level (default level is 0, first level)
Alerts
Used for managing internal or external Alerts. Usually, external Alerts are created by a third party autonomously via the API. This third party could be a provider or application. Internal Alerts can be defined from the console or using the API. Internal alerts will always be associated to a provider.
It’s also possible to delete the items massively from the alerts list.
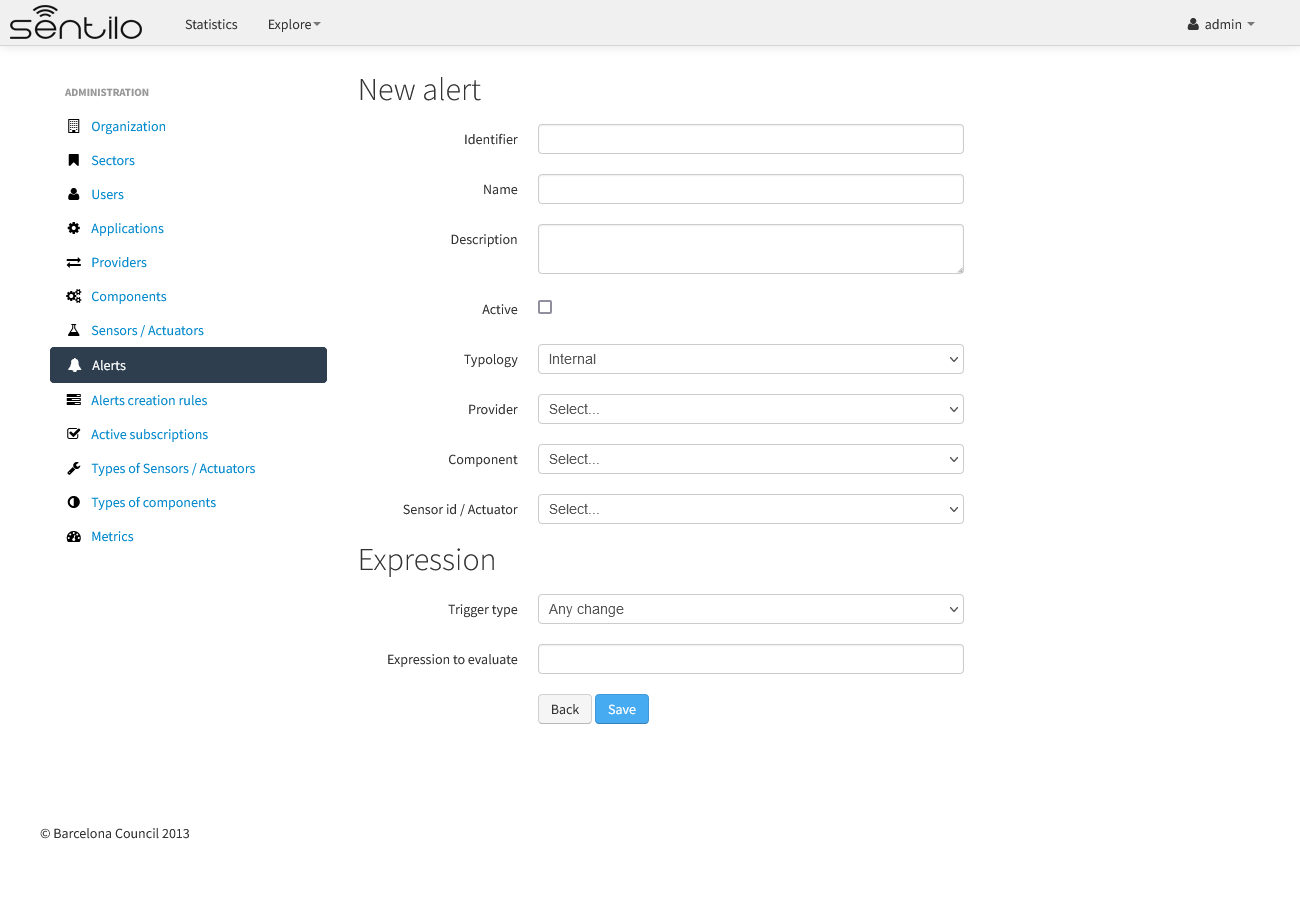
Create alerts
Thare are two types of alerts, and them has its own properties.
External alert
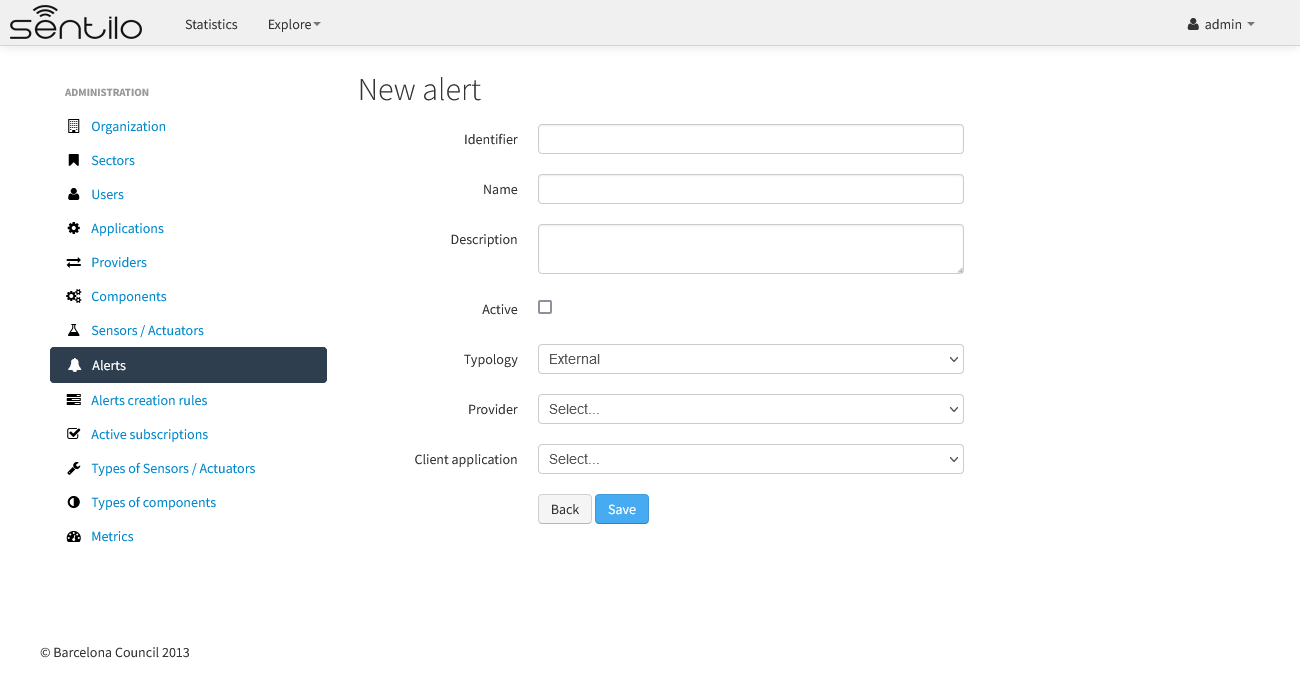
Internal alert
Properties
| Id | Name | Description |
|---|---|---|
| ID | Alert identifier | After its creation can’t be modified |
| Name | Display name | |
| Description | Description | |
| Active | Indicates whether the alert is activated or not | When a sensor goes into the offline state, the associated alerts are also automatically deactivated. |
| Creation date | Creation date | Automatically generated |
| Update date | Last update date | Automatically generated |
| Type | Alert type | Internal/External |
| Provider | Related provider | For external alerts, a provider which will generate the associated alarms. For internal alerts, the related data provider. |
| Application | Related provider | Only for external alerts, application which will generate the associated alarms |
| Component | Related component | Only for internal alerts |
| Sensor | Related sensor | Only for internal alerts |
| Trigger type | Type of trigger that will be applied | Only for internal alerts. Value list, see the API for details |
| Expression | Expression to be evaluated | Only for internal alerts |
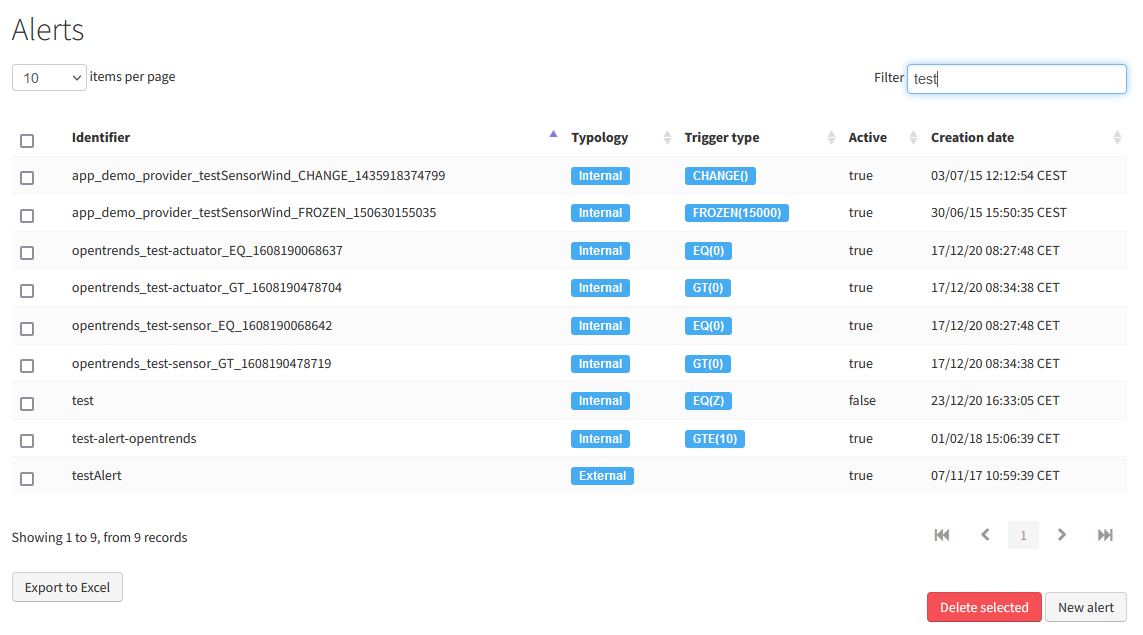
List
Access the Alerts list. This is the main Alert page. From here you’ll can access to the desired alert to show its details by click on it.
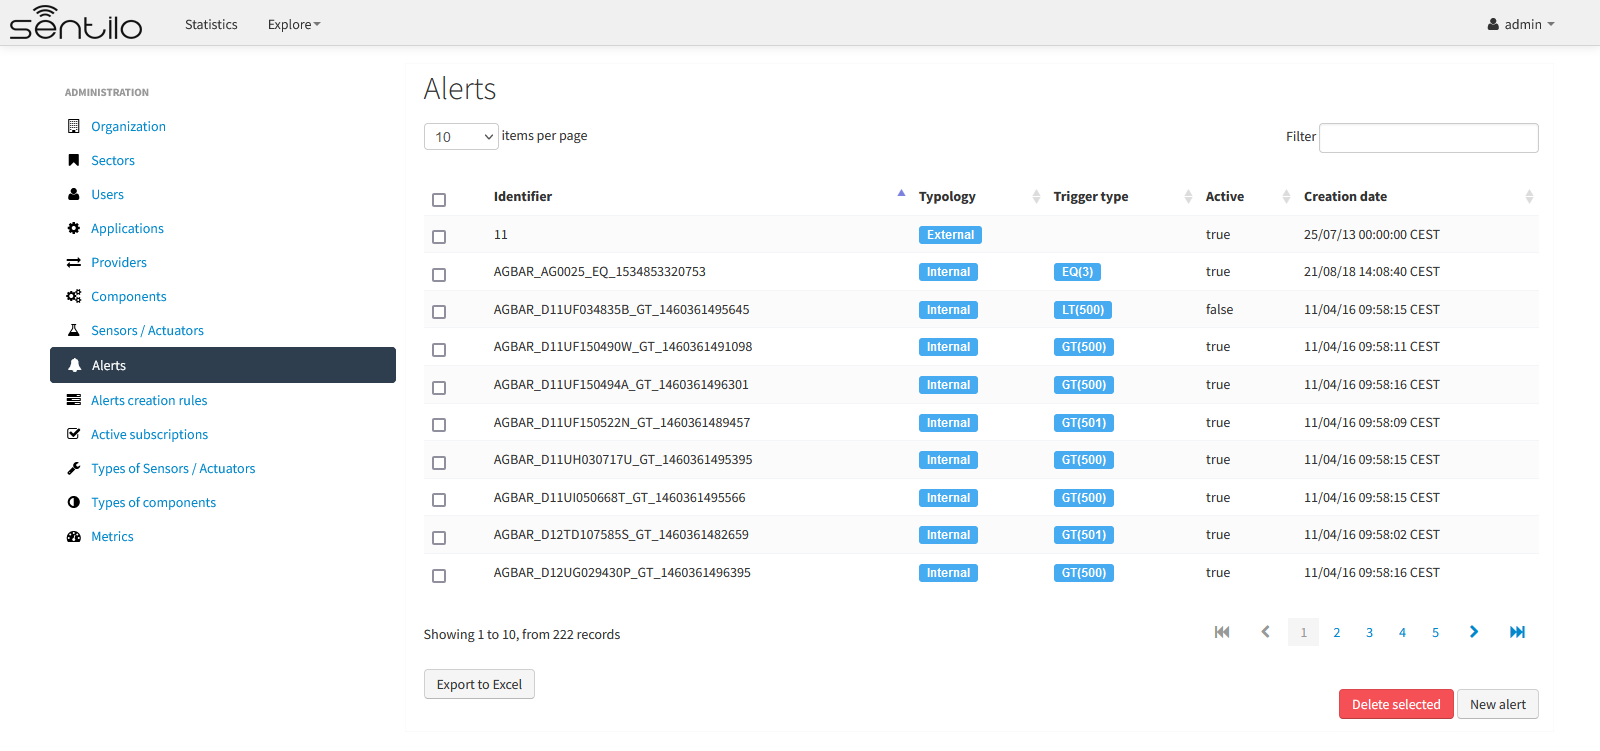
You’ll be able to list, filter, show alerts details, create (New alert button) and delete selected alerts (select from left checkbox, and apply by Delete selected button).
Further, you’ll be able to export the list to Excel, by clicking on Export to Excel button. The result file will contain the list columns and a number of extra ones from internal database use.
Use the button panel at the bottom right to navigate through the list (first page, previous page, page number, next page and last page, respectively).
Filtering the alerts list
It is possible to full-text search the list in the “filter” box. The field is case-sensitive. That means that you can search for full or partial text contained in the identifier, type, trigger or status field. If you want to search for certain trigger type, currently only searching by trigger type’s code is possible (e.g. a search for “GT” would return results in the above screen, whereas a search for “GT(40)” wouldn’t).
Alerts creation rules
It is possible to bulk-create alerts for a group of sensors. For example, attach a rain alert rule to all pluviometers of certain provider.
List
Accessing “Alert creation rules” menu option opens a list of existing Alert Rules.
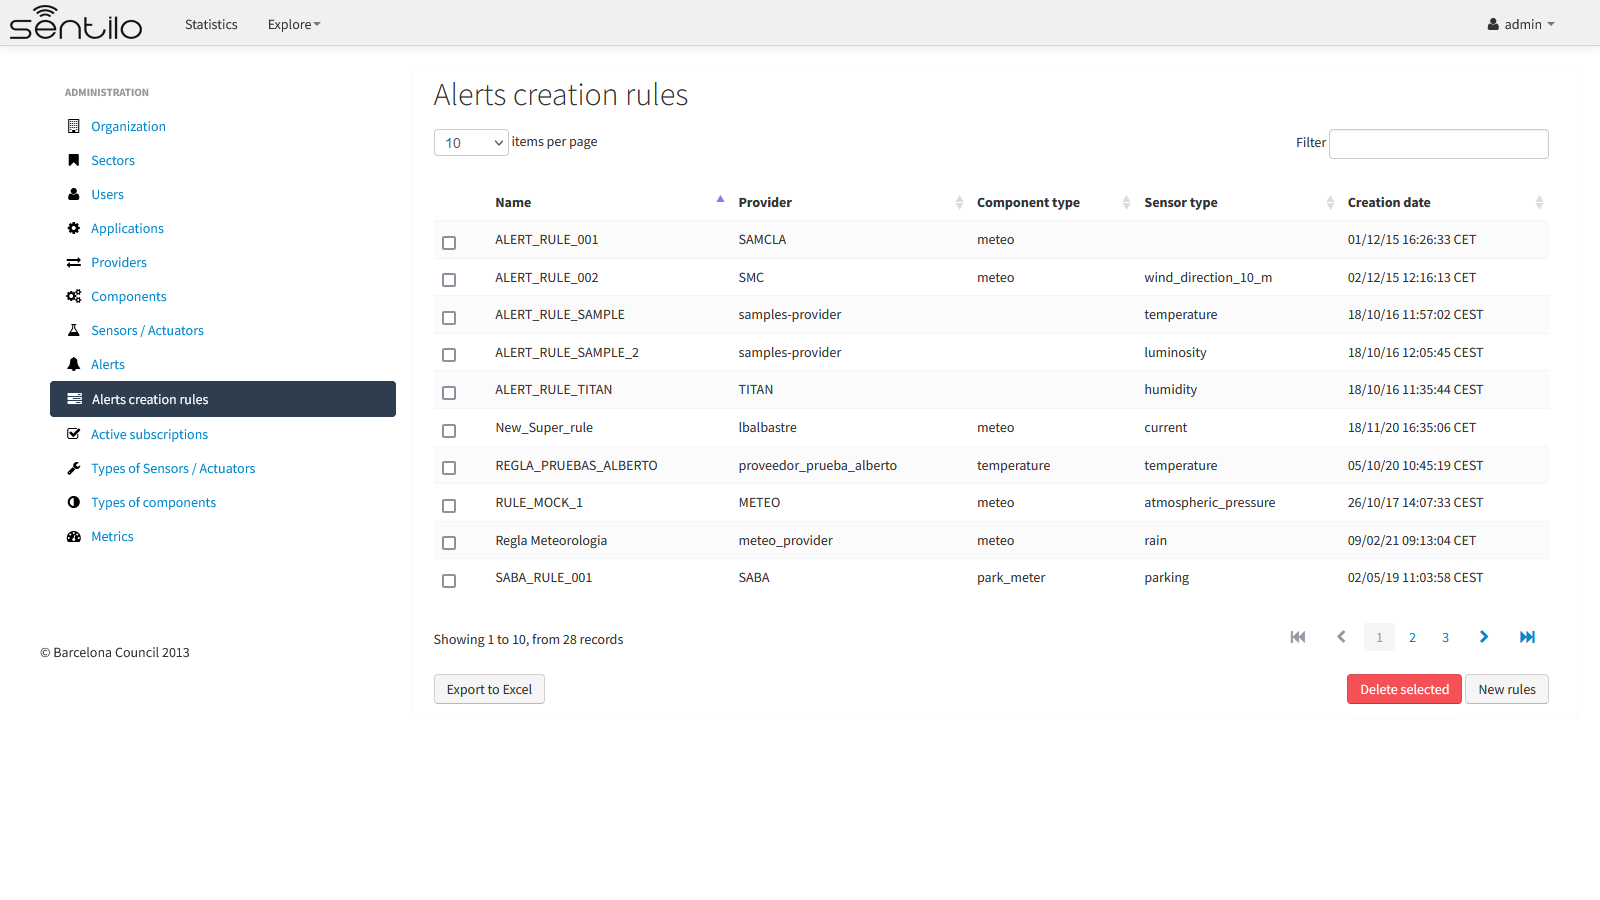
You’ll be able to list, filter, show alert rules details, create (New rules button) and delete selected rules group (select from left checkbox, and apply by Delete selected button).
Further, you’ll be able to export the list to Excel, by clicking on Export to Excel button. The result file will contain the list columns and a number of extra ones from internal database use.
Use the button panel at the bottom right to navigate through the list (first page, previous page, page number, next page and last page, respectively).
Create rules
To create new alerts, use the “New Rules” button.
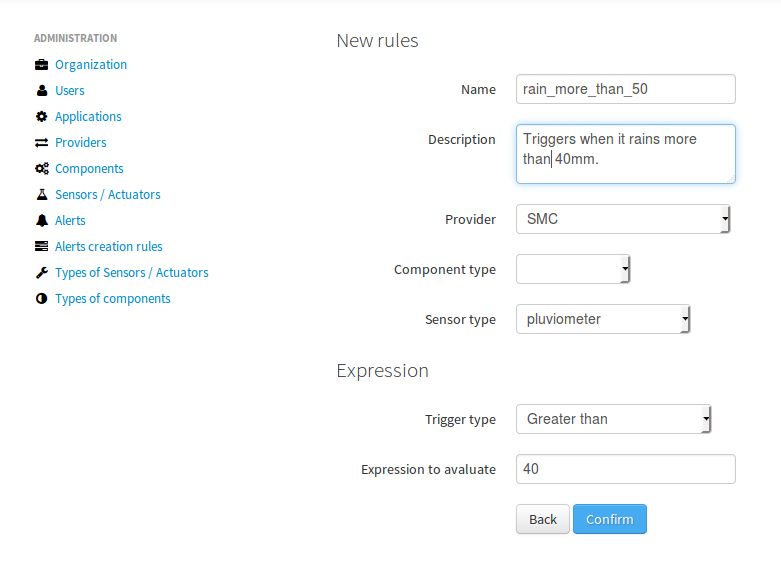
After pressing the “Confirm” button, a modal window will inform on how many alerts will be created for given combination of provider, component type and sensor type.
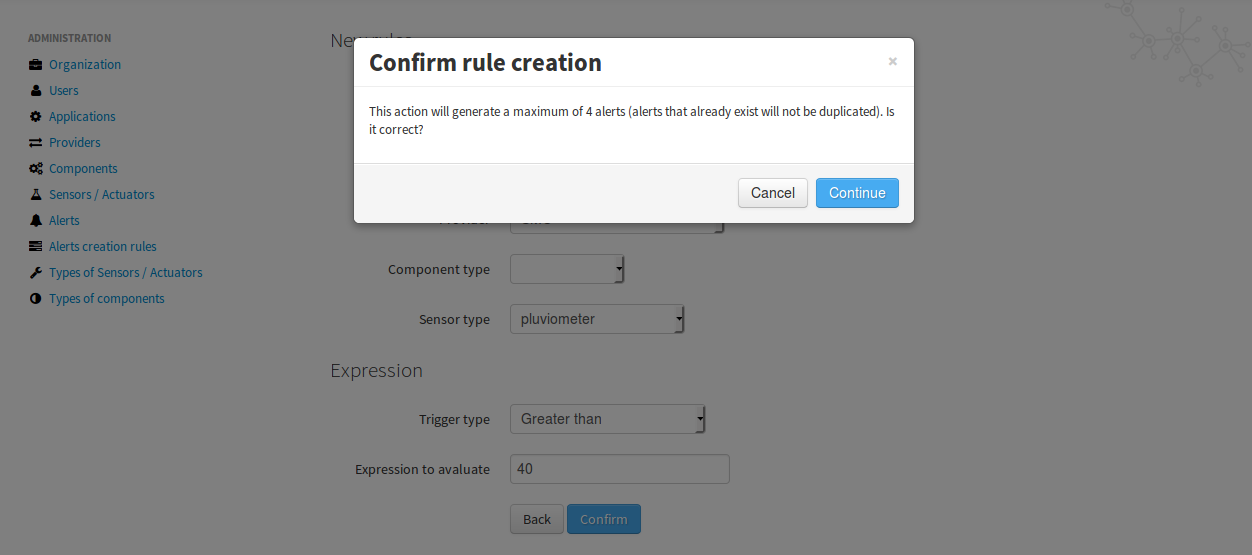
Subsequently, alerts are created, all having the same rule. At the moment it is not possible to bulk-create alerts without specifying the provider.
To bulk-delete alerts with associated with a particular rule, just select the item from the Alert Rule list and press Delete.
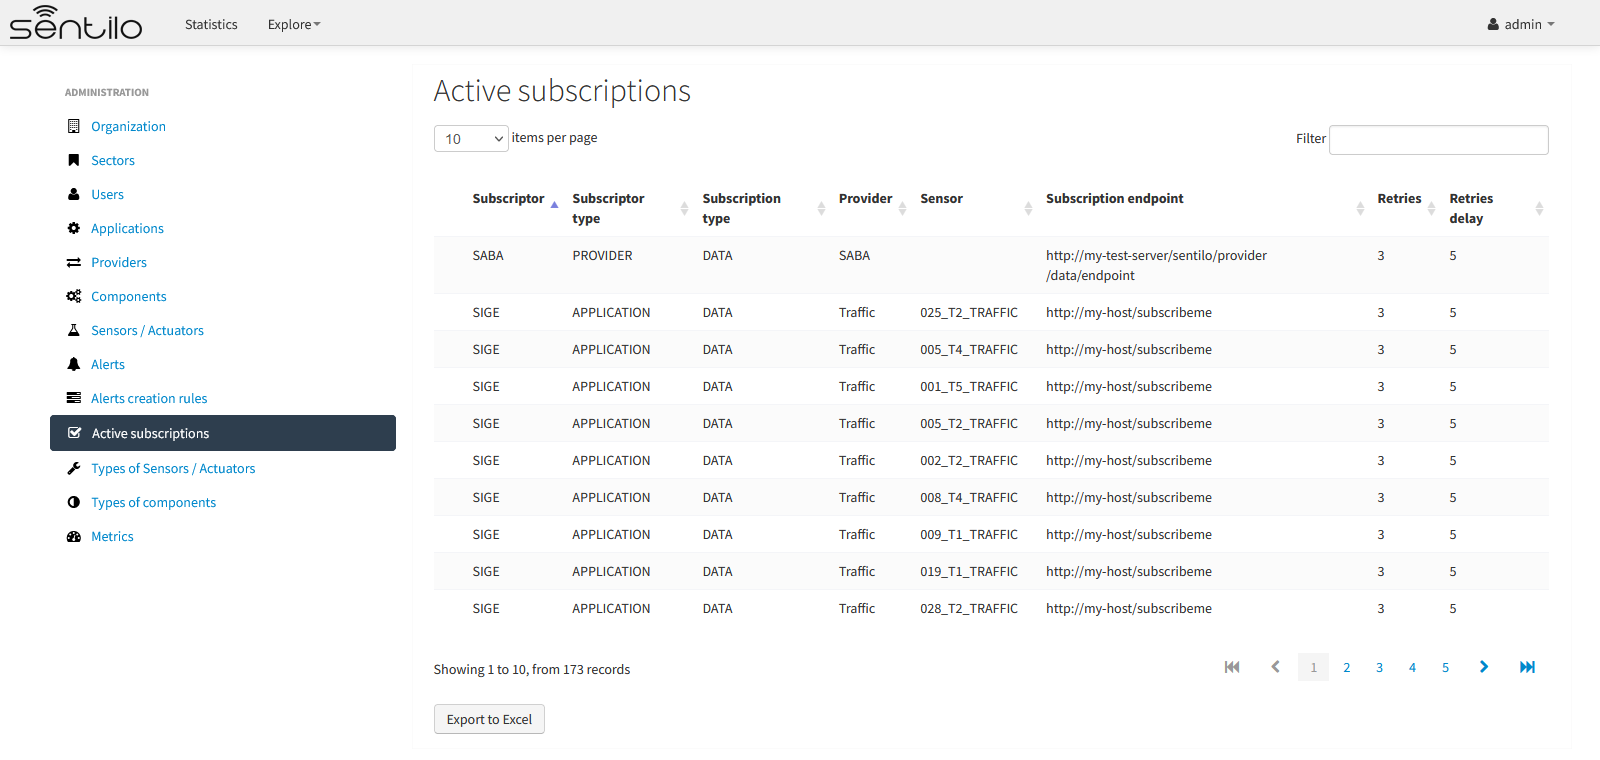
Active Subscriptions
Active Subscriptions is a handy section that gives a view of situation of the subscriptions to Sentilo.
The some system subscribes to Sentilo and then is inaccessible for a long time, this creates a unnecessary queue in the system.
Sensor types
Used for creating, updating or deleting sensor types. The sensor types should be defined through the administrator console before adding elements to the catalog.
It’s possible to delete elements massively through the sensor list.
Properties
| Id | Name | Description |
|---|---|---|
| Id | Type identifier | After its creation can’t be modified |
| Name | Display name | |
| Description | Description | |
| Creation date | Creation date | Automatically generated |
| Update date | Last update date | Automatically generated |
List
Access the main Type of Sensors / Actuators list page, will show you a complete list of type of sensors.
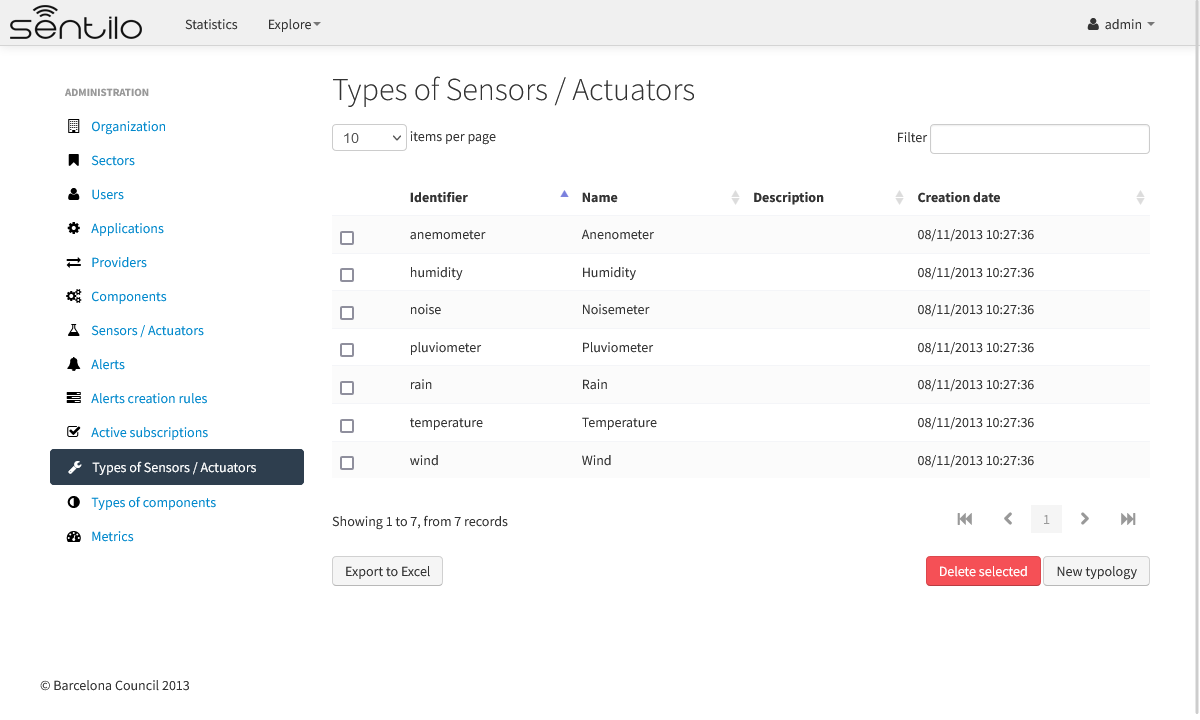
You’ll be able to list, filter, show typologies details, create (New typology button) and delete selected typology (select from left checkbox, and apply by Delete selected button).
Further, you’ll be able to export the list to Excel, by clicking on Export to Excel button. The result file will contain the list columns and a number of extra ones from internal database use.
Use the button panel at the bottom right to navigate through the list (first page, previous page, page number, next page and last page, respectively).
New
Access to create new typology pressing New typology button. You must inform an identifier, name and description (optional) for the new typology.
Component types
Used for creating, updating or deleting component types. The component types should be defined through the administrator console before adding elements to the catalog.
It’s possible to delete elements massively through the component list.
List
Access the main Component’s typology list page, will show you a complete list of available type of components.
You’ll be able to list, filter, show typology details, create (New application button) and delete selected typologies (select from left checkbox, and apply by Delete selected button).
Further, you’ll be able to export the list to Excel, by clicking on Export to Excel button. The result file will contain the list columns and a number of extra ones from internal database use.
Use the button panel at the bottom right to navigate through the list (first page, previous page, page number, next page and last page, respectively).
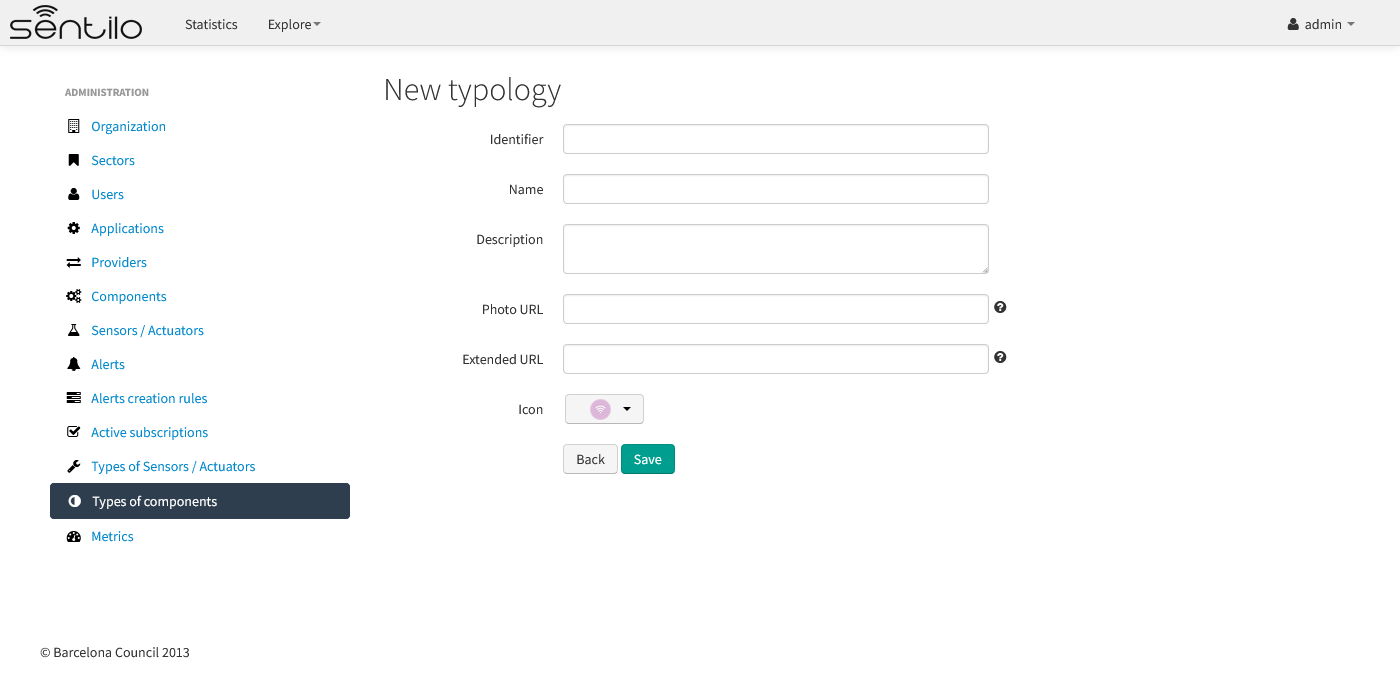
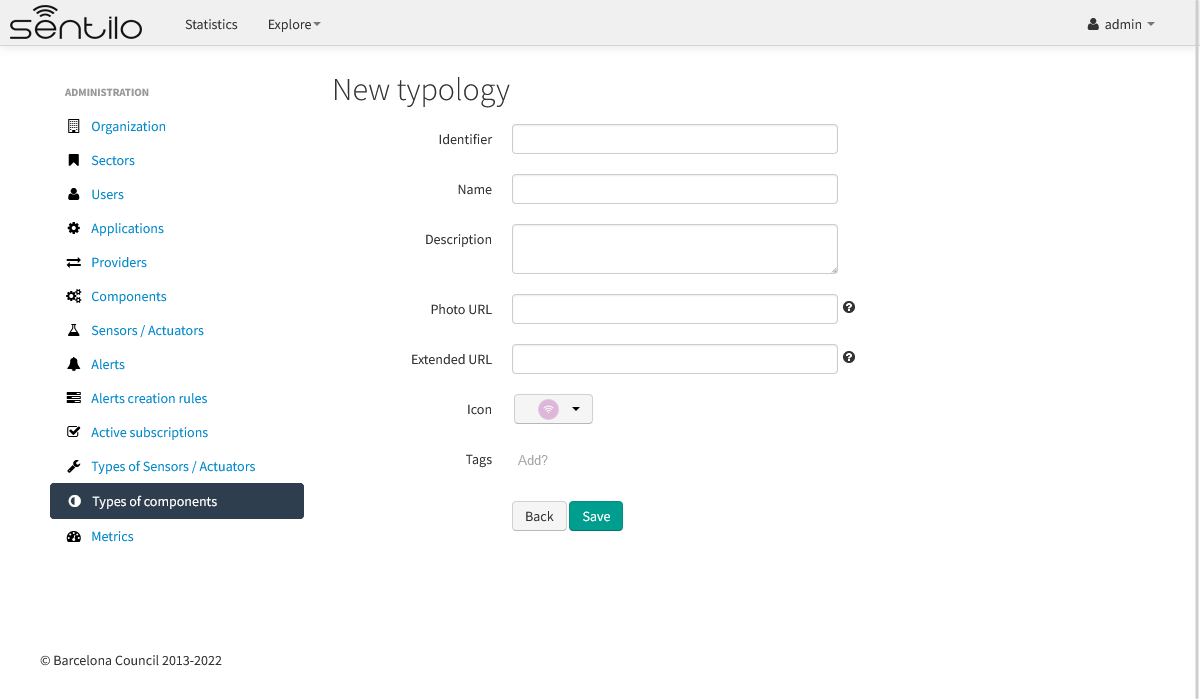
New
Access to create new typology pressing New typology button. You must inform an identifier, name, description (optional), photo (optional) and icon for the new typology.
Properties
| Id | Name | Description |
|---|---|---|
| Id | Type identifier | After its creation can’t be modified |
| Name | Display name | |
| Description | Description | |
| Creation date | Creation date | Automatically generated |
| Update date | Last update date | Automatically generated |
| Photo URL | Related photo | Generic picture for the component type, will be used if there isn’t any specified for the component itself |
| Extended URL | Define an external details page for the component type | Here you can inform an external url that will replace the default component details page for all componenents of the type, if them hasn’t defined its own one |
| Icon | Related icon | Value list from the deployed icon list. Used in the maps for representing the component |
| Tags | organizational tag | Typology categorization tags list separated by comma / enter. It is used to create organizational categories in the Universal Map Viewer typology filter tree |
Note
The extended URL allows to replace the component details, integrating an external page within the general framework of the application. It must be an absolute URL and accessible without authentication (only http or https protocols are accepted). It will be used for all the typology components, except for the ones configuring their own URL. It can include the following wildcards ${component_id} and/or ${provider_id}, which will be replaced at execution time.
Note
A component typology can contain one, several or no associated tags. For each one of them, the typology will be located within the branch that bears the same name in the filter tree by typology categories in the universal map viewer. If a typology does not contain any tags, this typology will appear in the “Other” category in the filter tree by typology categories of the universal map viewer.
Metrics
The new Metrics section provides a real-time monitoring of all Sentilo modules, including agents. This information is useful when you want to rapidly assess the state of the service. However, for production monitoring, we recommend to also setup some process watcher and alerting system.
Example of the timeline:
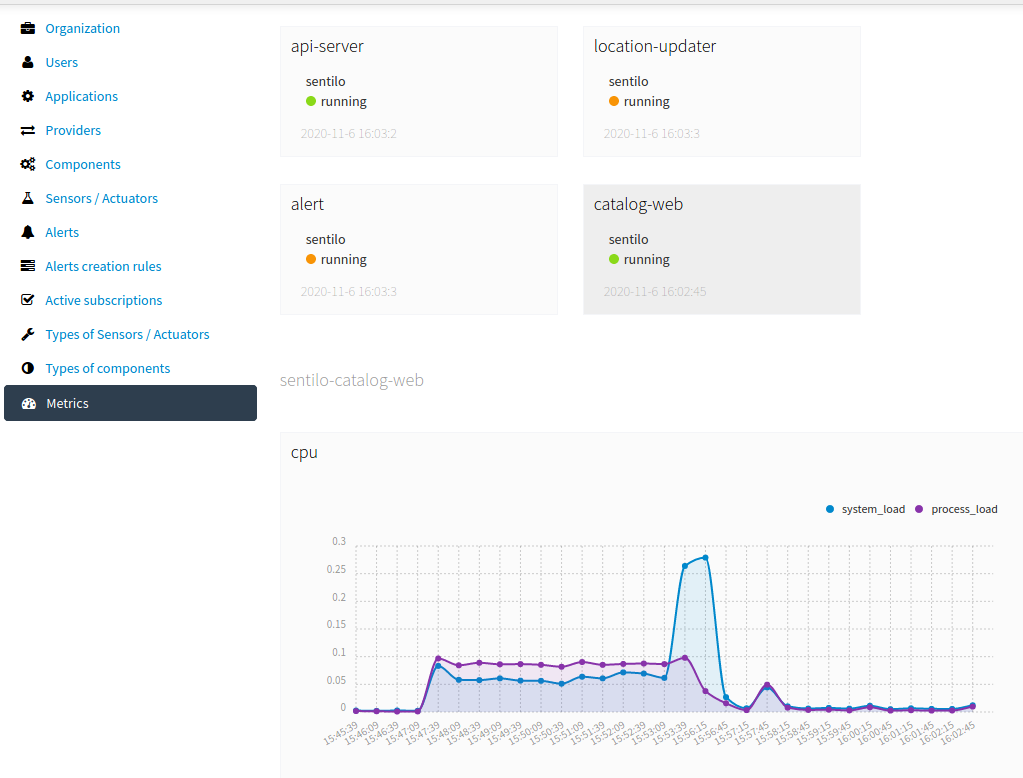
Example of dashboard:
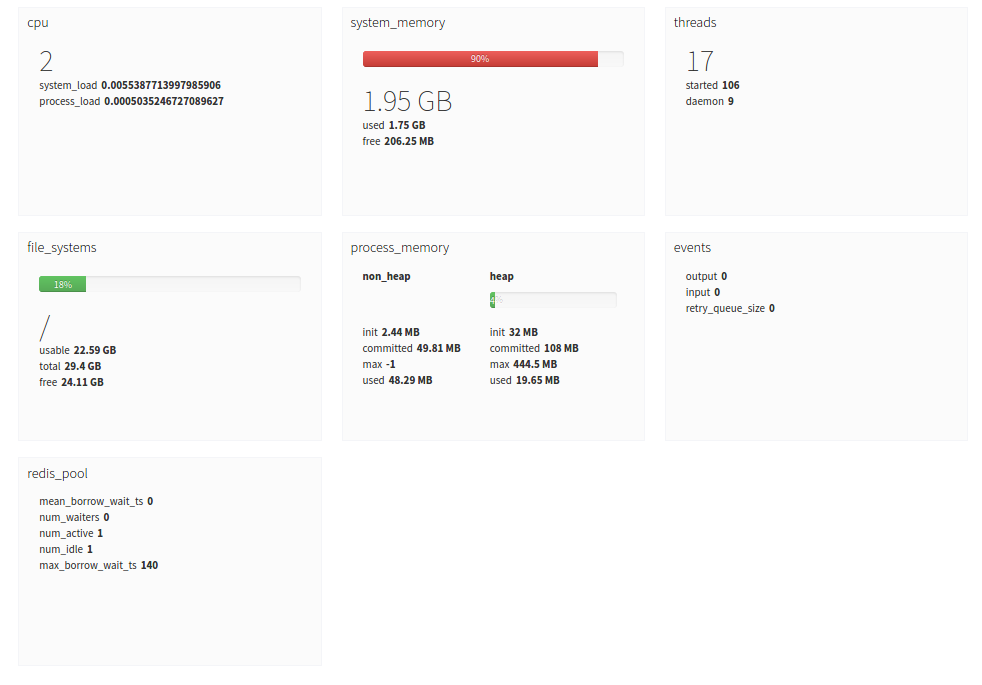
Note
Since the metrics are in real-time only, no history is shown unless you leave the Metrics page open for a while. The page will show graphics for this time. If you reload the page, the history will be reset.
New internal monitor API runs on different port that the Sentilo API. It’s port number is configured in
/sentilo-platform/sentilo-platform-service/src/main/resources/properties/sentilo-server.conf. The default value is 7081.
monitor.port=7081
The agent Metrics Monitor Agent gathers these metrics and persists them in Elasticsearch.