Map Viewers
In the publicly accessible section of the Catalog, Sentilo offers two different map viewers that display data in real-time, as they are being published in the system.
Both viewers are accessible from the Explore item at the top menu bar (Universal viewer and Route viewer).
Universal viewer
Components map
The catalog provides a default map, based on Google Maps, which shows all the public components registered at the platform. If the user is logged as administrator, all the private components will be displayed as well.
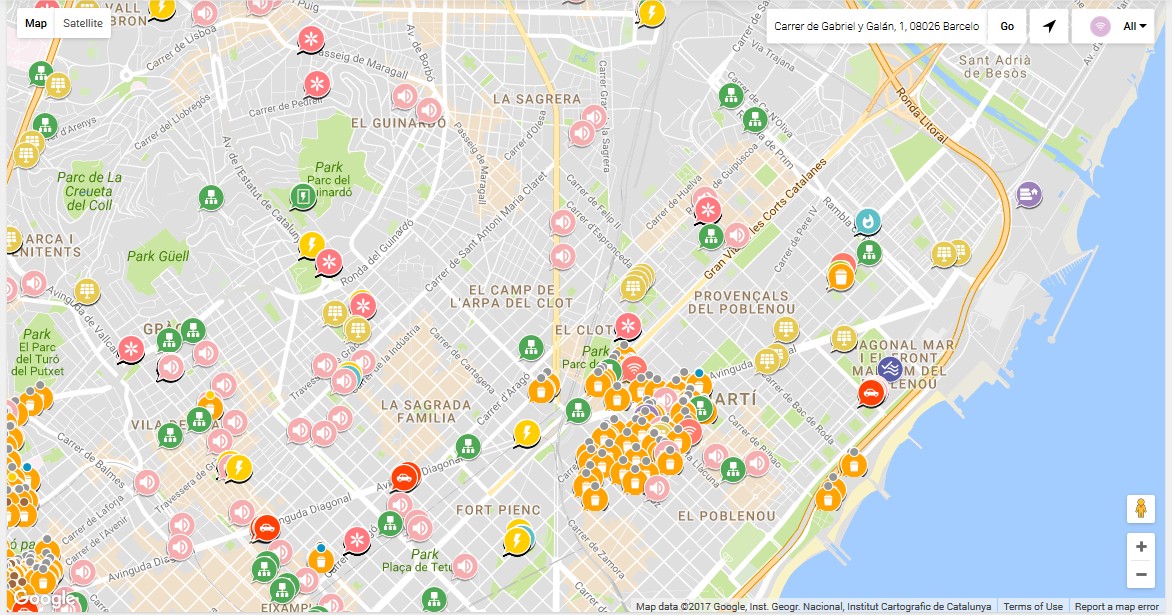
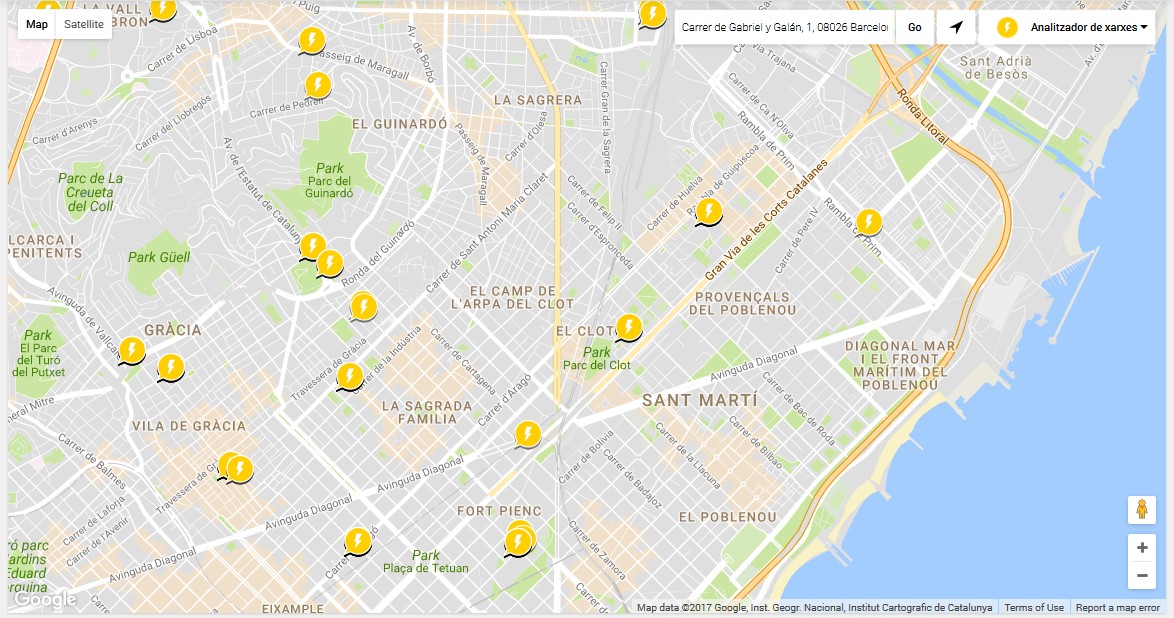
On this page, you can filter the components to show by selecting a component type from the top left select.
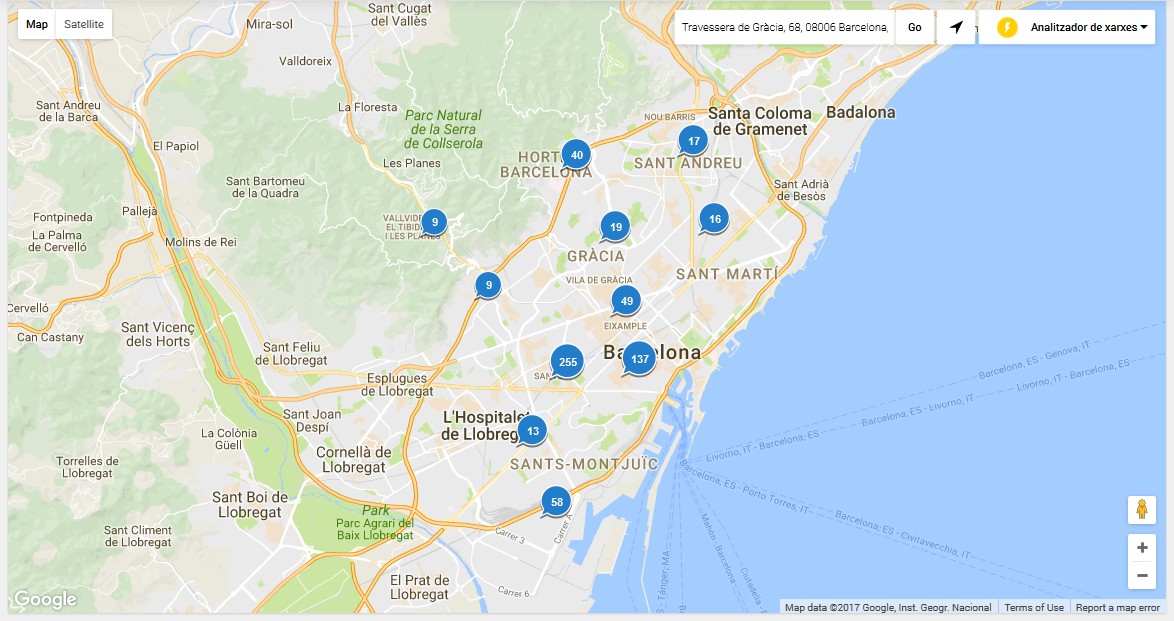
Depending on the zoom level, the map will display the elements as individuals POIs or grouped in clusters, showing the number of components in each group.
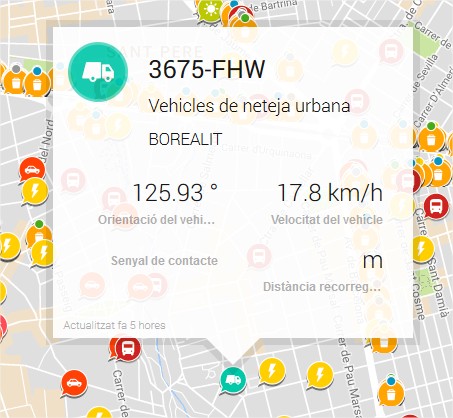
Component details
Sensors list
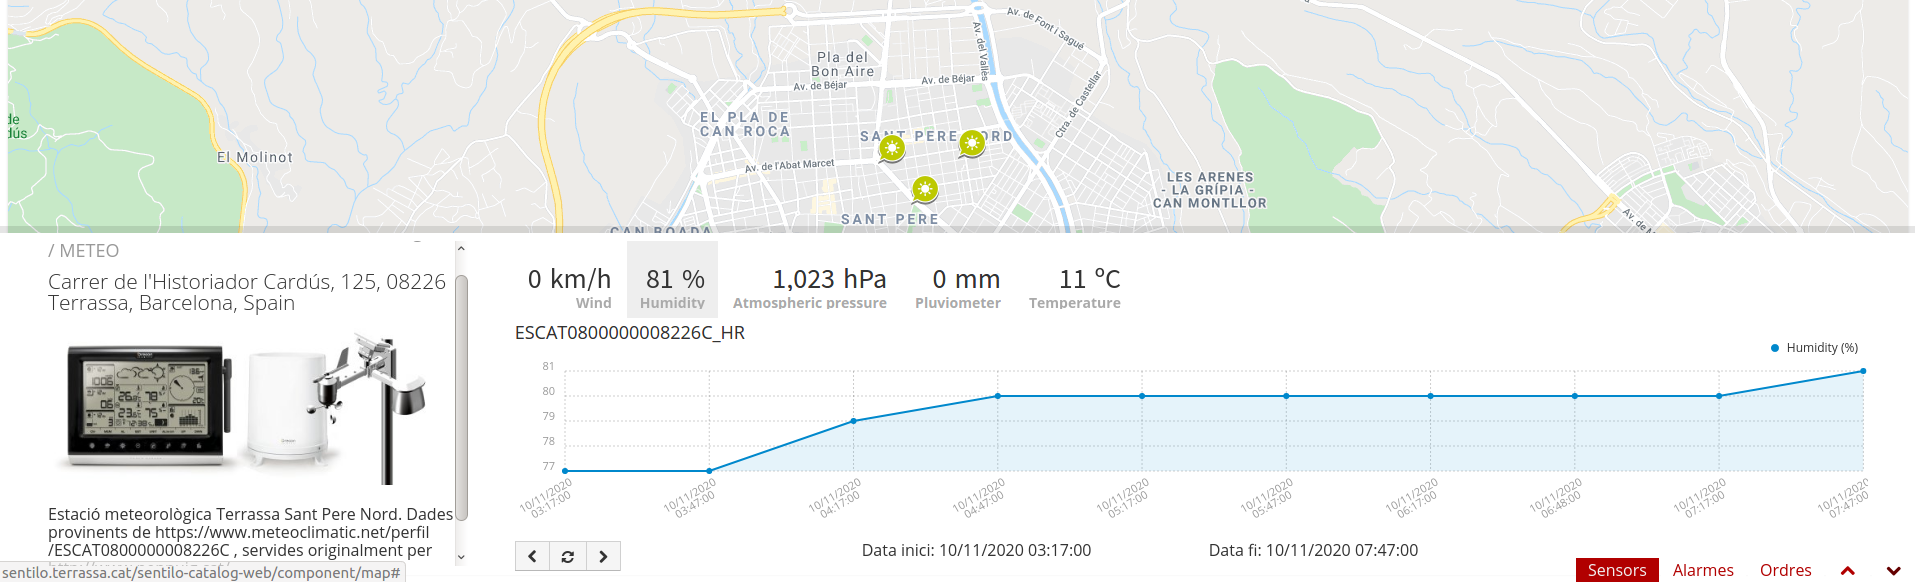
When you select a component, a popup window is opened above the map and displays the list of sensors related to it with the last activity for each one of them (as noted above, the private sensors will be displayed only for logged users):
Sensors last activity view
If you click into the content area of the popup window, a new page is open displaying some basic details about the component, and a time-series graph with the last activity of each of its sensors:
You may also click the bottom-right corner icon  and get a page with bigger detail. The URL of this page is shareable, i.e. it is possible to send it by email.
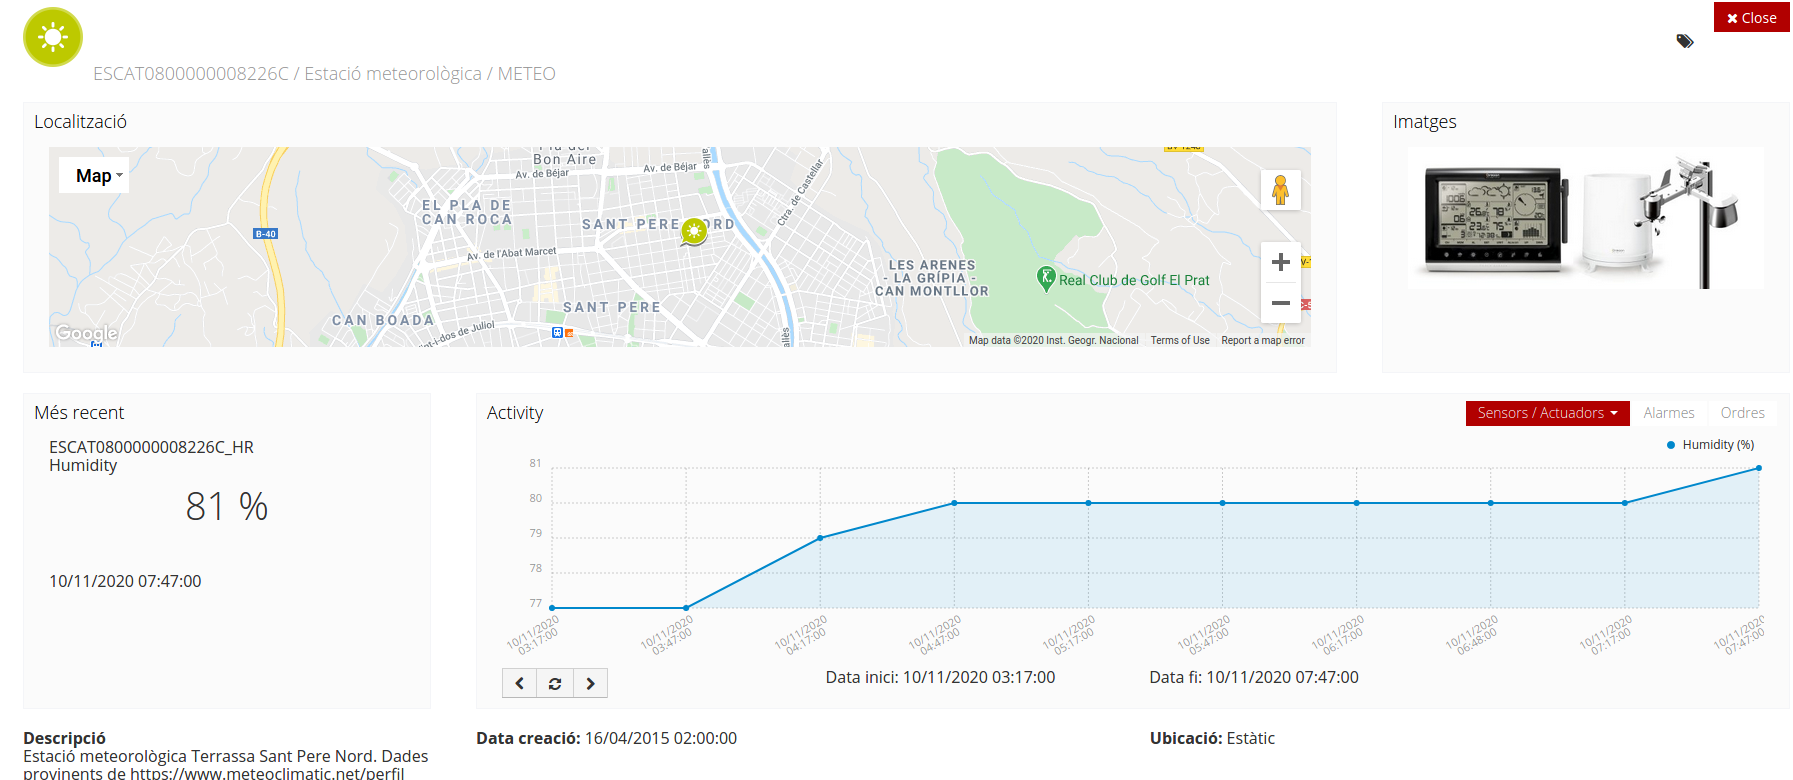
You can navigate along the dates of the graph by using the buttons located in the lower right corner of it:
- left arrow: navigate to the past (only if there are older data)
- reload data (center button): reload last data / reset chart data
- right arrow: navigate to the future (only if you have navigated or gone into the past before)
Displaying complex data
In some cases, you may want to inform complex data as an observation on Sentilo, such like a large json object. For these cases, Sentilo will detect that the text is a json object and then it will be shown to you as a prettify json value:
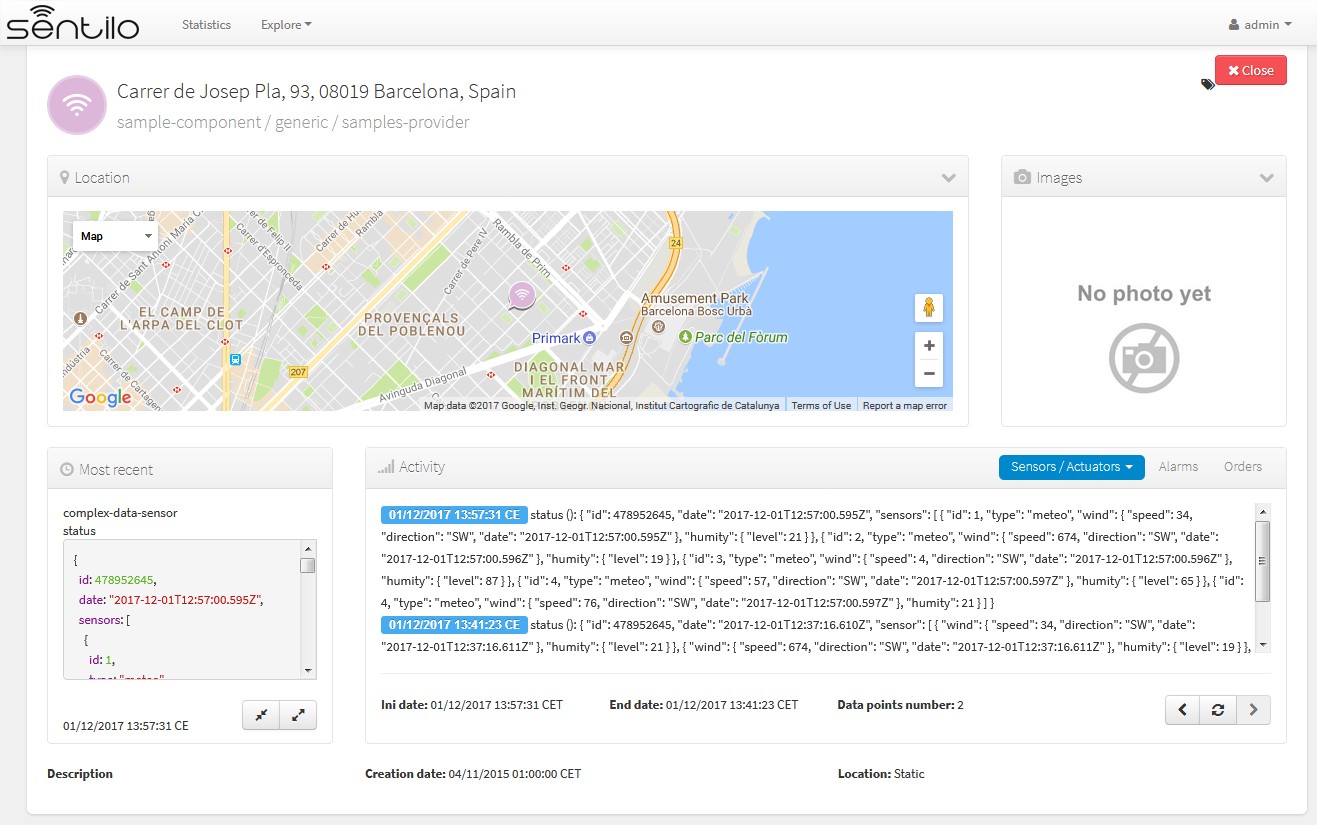
You can expand or compress the prettified json with the bottom buttons under the status field,
Route viewer
As the name suggest, the route viewer is a specific map that shows the routes followed by the mobile components (keep in mind that only the last 20 points are displayed for each route):
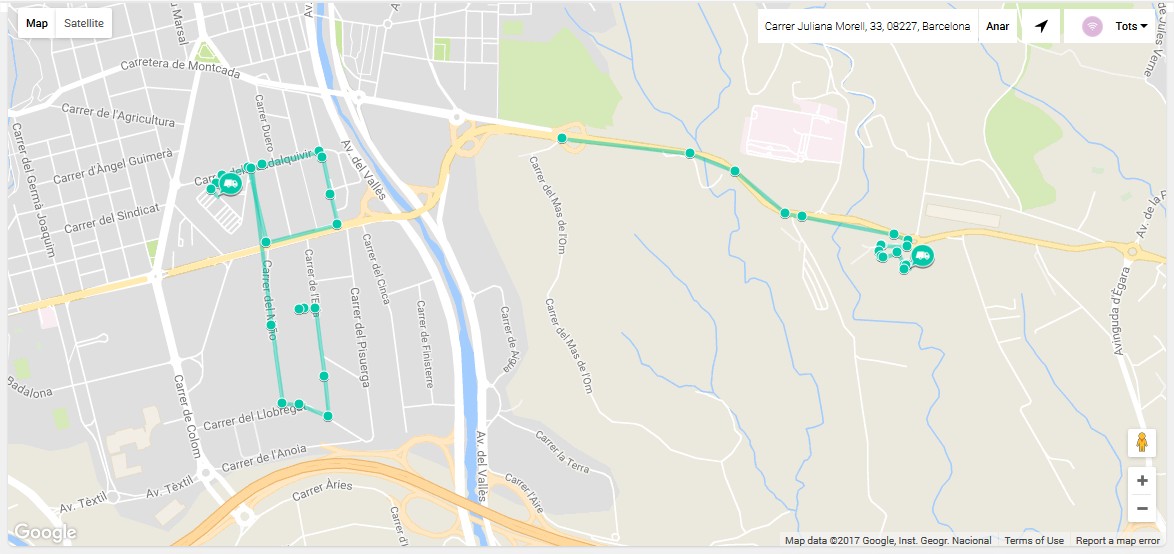
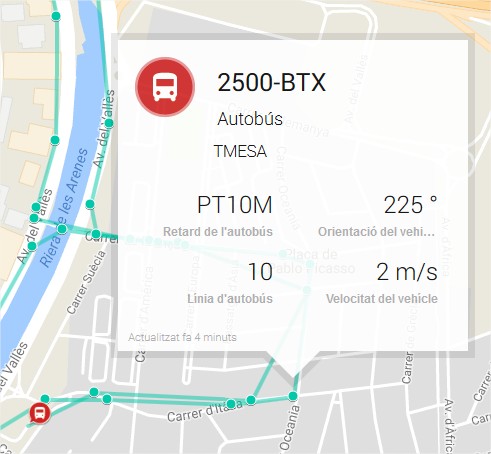
The same features described previously apply on this map and its markers (popup window, … ), but with the particularity that if you click over a route point then the popup window displays sensor activity related to the time instant in which component was at that location.
Background map configuration
Center and Zoom
Each Organization can have it’s own map center and zoom level. Please refer to corresponding part in the Administration Console section: Organization Map configuration
Map Providers
For all background maps, you can use either Google or Leaflet map provider. Through the latter you can consume any OGC WMS/WMTS service that provides a EPSG 3857 SRID.
The configuration of both is in in /sentilo-catalog-web/src/main/resources/properties/catalog-config.properties.
Example of Google Maps configuration
catalog.map.provider=gmaps
catalog.map.google.key=AIza...
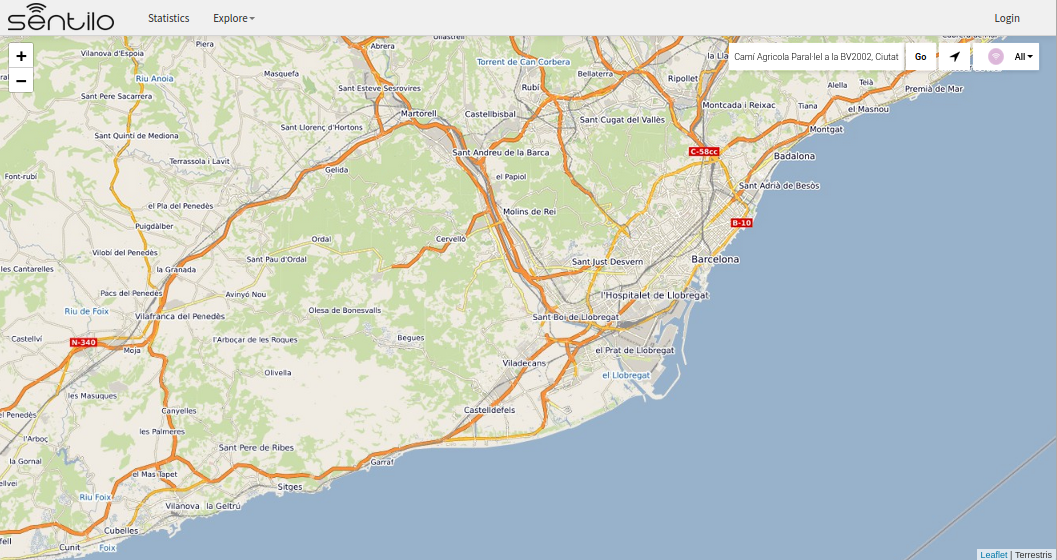
Example of Leaflet maps configuration, using a public Terrestris WMS service:
catalog.map.provider=leaflet
catalog.map.wms.url=https://ows.terrestris.de/osm/service?
catalog.map.wms.layers=OSM-WMS
catalog.map.wms.version=1.3.0
catalog.map.wms.format=image/jpeg
catalog.map.wms.attribution=Terrestris
catalog.map.wms.styles=
Note
If you insert multiple layers in the catalog.map.wms.layers property, a layer selector in the bottom-right corner of the map will appear.